Do Homeworkwilliam h wdhenke Bb Blackboard Learn fi https
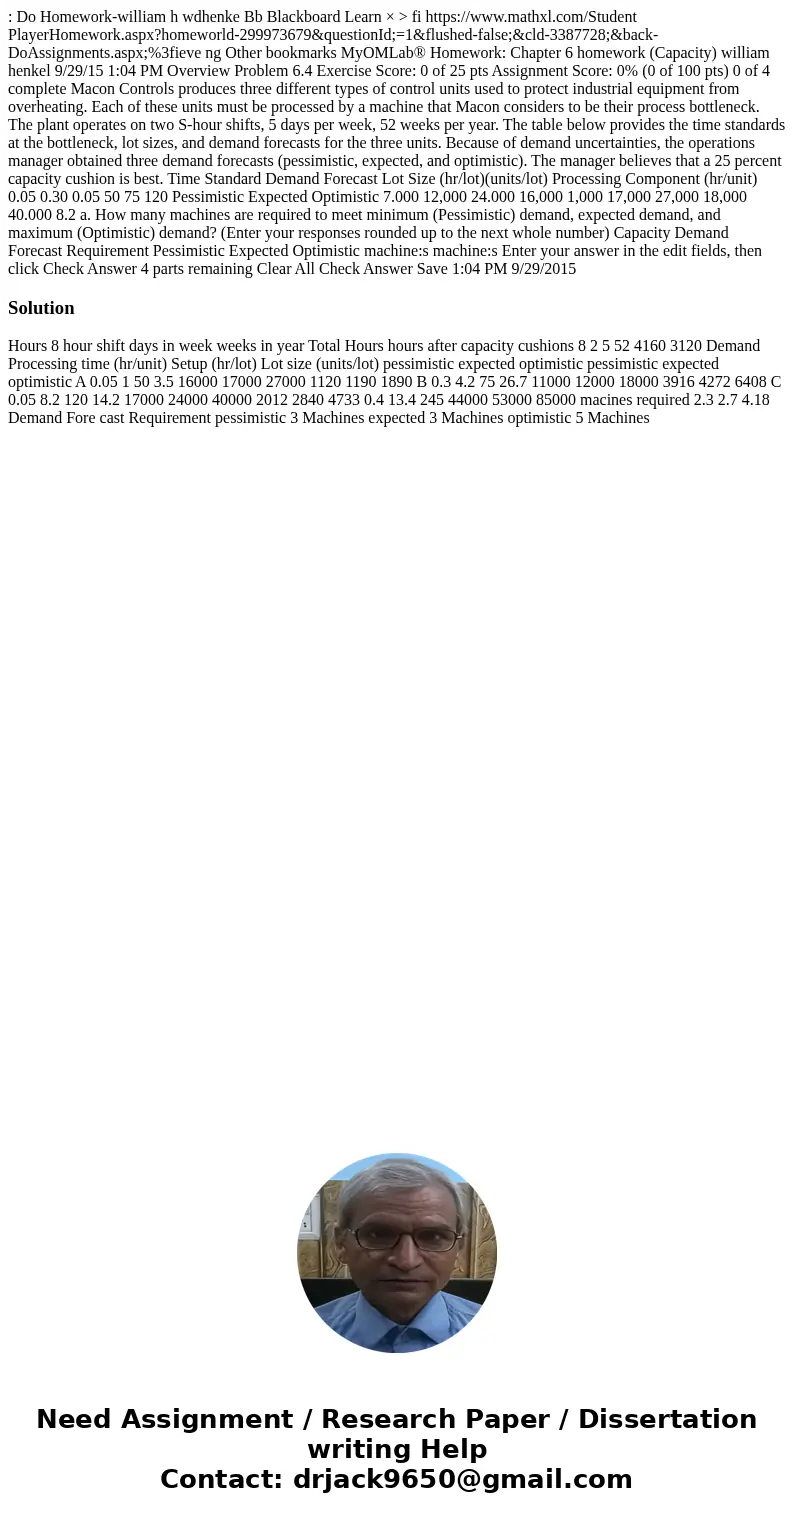
: Do Homework-william h wdhenke Bb Blackboard Learn × > fi https://www.mathxl.com/Student PlayerHomework.aspx?homeworld-299973679&questionId;=1&flushed-false;&cld-3387728;&back-DoAssignments.aspx;%3fieve ng Other bookmarks MyOMLab® Homework: Chapter 6 homework (Capacity) william henkel 9/29/15 1:04 PM Overview Problem 6.4 Exercise Score: 0 of 25 pts Assignment Score: 0% (0 of 100 pts) 0 of 4 complete Macon Controls produces three different types of control units used to protect industrial equipment from overheating. Each of these units must be processed by a machine that Macon considers to be their process bottleneck. The plant operates on two S-hour shifts, 5 days per week, 52 weeks per year. The table below provides the time standards at the bottleneck, lot sizes, and demand forecasts for the three units. Because of demand uncertainties, the operations manager obtained three demand forecasts (pessimistic, expected, and optimistic). The manager believes that a 25 percent capacity cushion is best. Time Standard Demand Forecast Lot Size (hr/lot)(units/lot) Processing Component (hr/unit) 0.05 0.30 0.05 50 75 120 Pessimistic Expected Optimistic 7.000 12,000 24.000 16,000 1,000 17,000 27,000 18,000 40.000 8.2 a. How many machines are required to meet minimum (Pessimistic) demand, expected demand, and maximum (Optimistic) demand? (Enter your responses rounded up to the next whole number) Capacity Demand Forecast Requirement Pessimistic Expected Optimistic machine:s machine:s Enter your answer in the edit fields, then click Check Answer 4 parts remaining Clear All Check Answer Save 1:04 PM 9/29/2015 
Solution
Hours 8 hour shift days in week weeks in year Total Hours hours after capacity cushions 8 2 5 52 4160 3120 Demand Processing time (hr/unit) Setup (hr/lot) Lot size (units/lot) pessimistic expected optimistic pessimistic expected optimistic A 0.05 1 50 3.5 16000 17000 27000 1120 1190 1890 B 0.3 4.2 75 26.7 11000 12000 18000 3916 4272 6408 C 0.05 8.2 120 14.2 17000 24000 40000 2012 2840 4733 0.4 13.4 245 44000 53000 85000 macines required 2.3 2.7 4.18 Demand Fore cast Requirement pessimistic 3 Machines expected 3 Machines optimistic 5 Machines
 Homework Sourse