Use Information 1 to construct a table that show the value t
Use Information #1 to construct a table that show: the value; the frequency; the relative frequency: and the cumulative frequency. Thon draw a combined overlaid cumulative frequency bar chart and cumulative frequency polygon.

Solution
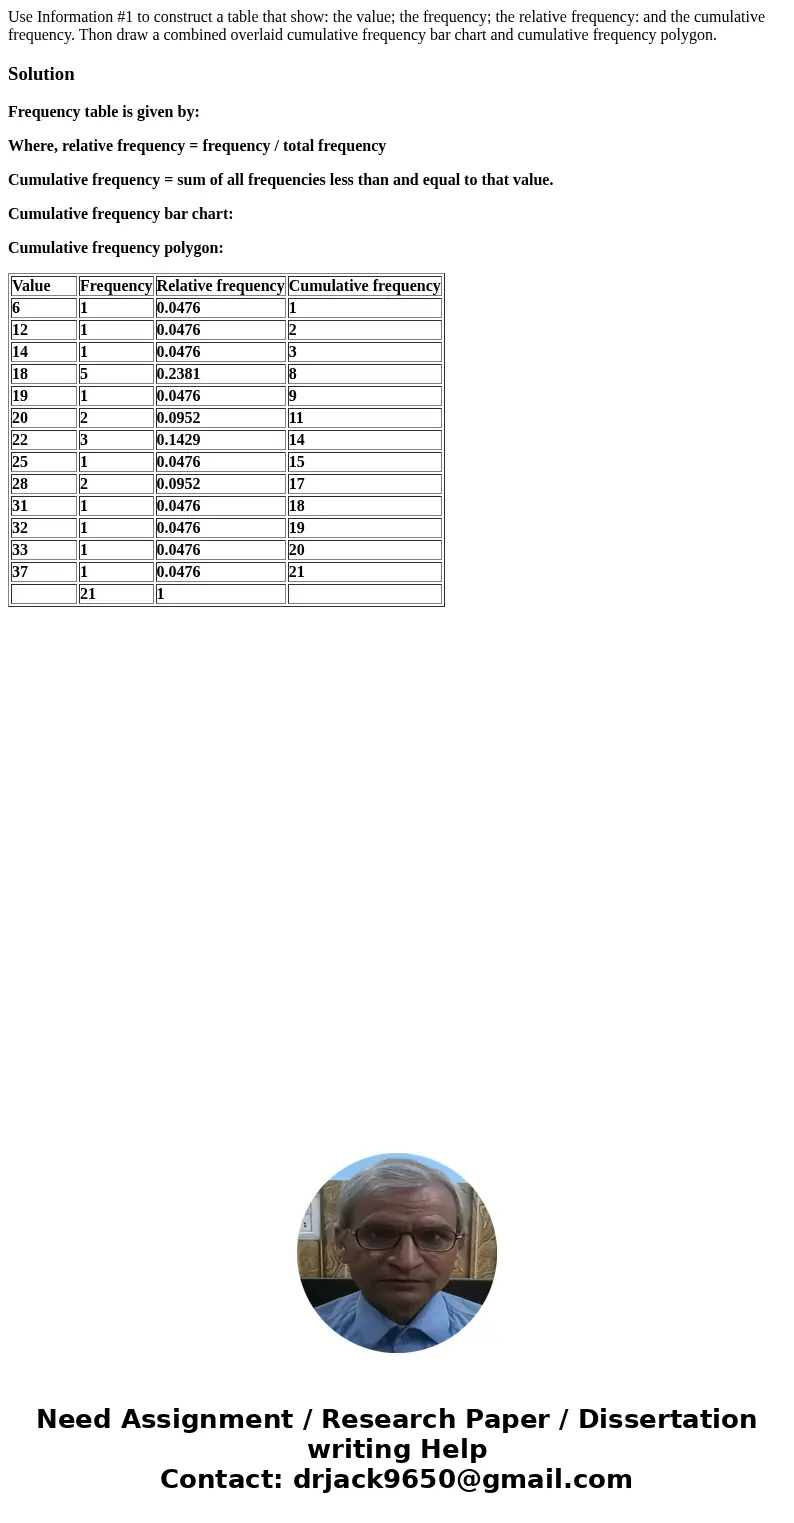
Frequency table is given by:
Where, relative frequency = frequency / total frequency
Cumulative frequency = sum of all frequencies less than and equal to that value.
Cumulative frequency bar chart:
Cumulative frequency polygon:
| Value | Frequency | Relative frequency | Cumulative frequency |
| 6 | 1 | 0.0476 | 1 |
| 12 | 1 | 0.0476 | 2 |
| 14 | 1 | 0.0476 | 3 |
| 18 | 5 | 0.2381 | 8 |
| 19 | 1 | 0.0476 | 9 |
| 20 | 2 | 0.0952 | 11 |
| 22 | 3 | 0.1429 | 14 |
| 25 | 1 | 0.0476 | 15 |
| 28 | 2 | 0.0952 | 17 |
| 31 | 1 | 0.0476 | 18 |
| 32 | 1 | 0.0476 | 19 |
| 33 | 1 | 0.0476 | 20 |
| 37 | 1 | 0.0476 | 21 |
| 21 | 1 |

 Homework Sourse