One can show that twosample tests are a special case of ANOV
One can show that two-sample tests are a special case of ANOVA. Using the data in Problem #2 perform ANOVA. -- Data is :: A sample of hourly wages of fast food chain workers for two cities are as follows:
City A: 5, 7, 9 City B: 10, 14, 15
1. Construct the ANOVA summary table. Calculation for SS(total) = 76.
2. Show all steps of hypothesis testing.
3. Based on your conclusion in part (b) and without calculating the 95% confidence interval for the mean difference between City A and City B hourly wages, would a mean difference of 0 be found within the confidence interval or outside of the confidence interval? Briefly explain.
4. Compare F-statistic with (t-statistic)2 from Problem #2. What can you say about your finding?
Solution
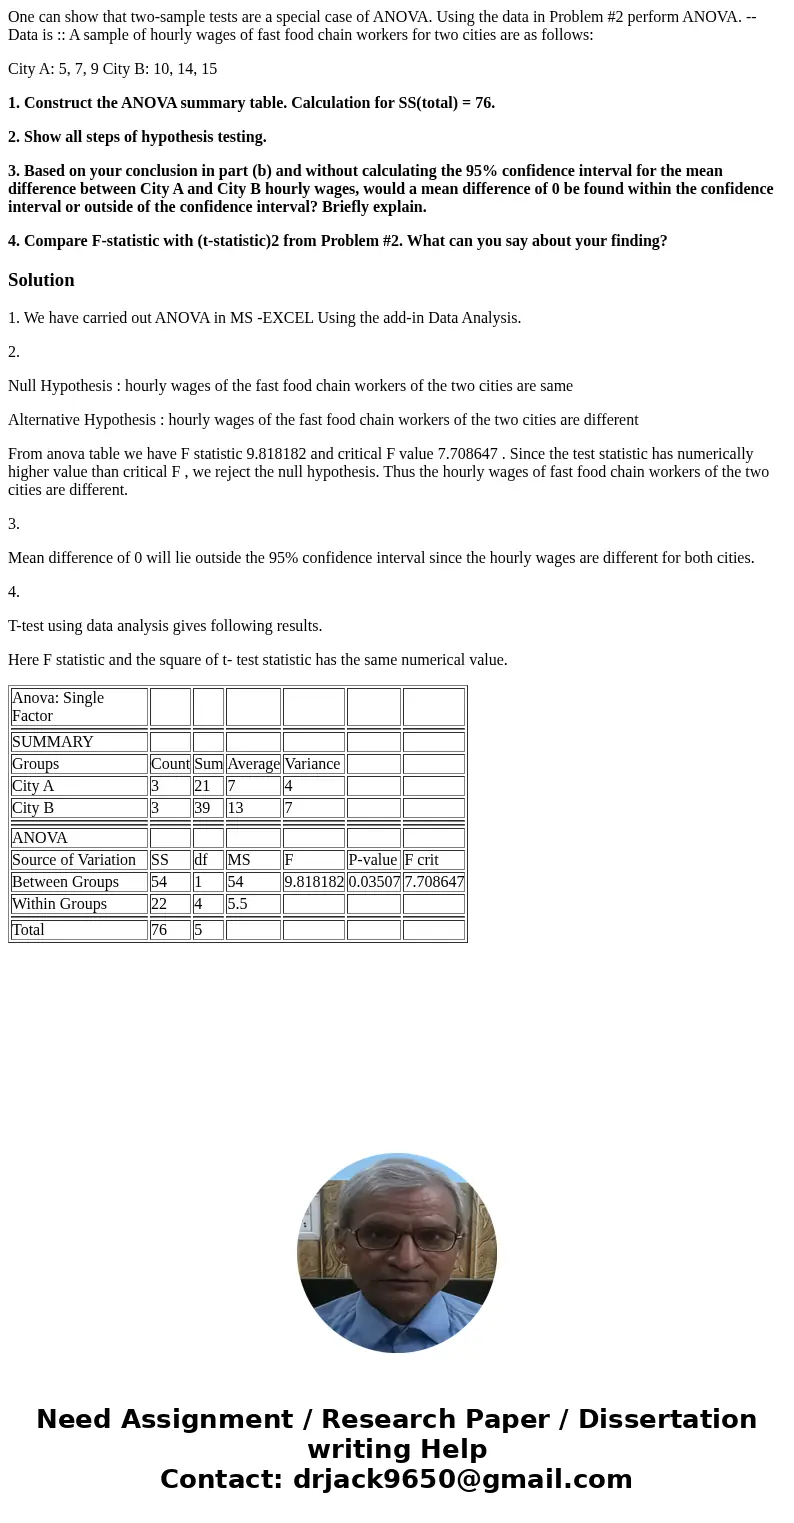
1. We have carried out ANOVA in MS -EXCEL Using the add-in Data Analysis.
2.
Null Hypothesis : hourly wages of the fast food chain workers of the two cities are same
Alternative Hypothesis : hourly wages of the fast food chain workers of the two cities are different
From anova table we have F statistic 9.818182 and critical F value 7.708647 . Since the test statistic has numerically higher value than critical F , we reject the null hypothesis. Thus the hourly wages of fast food chain workers of the two cities are different.
3.
Mean difference of 0 will lie outside the 95% confidence interval since the hourly wages are different for both cities.
4.
T-test using data analysis gives following results.
Here F statistic and the square of t- test statistic has the same numerical value.
| Anova: Single Factor | ||||||
| SUMMARY | ||||||
| Groups | Count | Sum | Average | Variance | ||
| City A | 3 | 21 | 7 | 4 | ||
| City B | 3 | 39 | 13 | 7 | ||
| ANOVA | ||||||
| Source of Variation | SS | df | MS | F | P-value | F crit |
| Between Groups | 54 | 1 | 54 | 9.818182 | 0.03507 | 7.708647 |
| Within Groups | 22 | 4 | 5.5 | |||
| Total | 76 | 5 |

 Homework Sourse