The demand model relating the quantity of good XYZ sold QXYZ
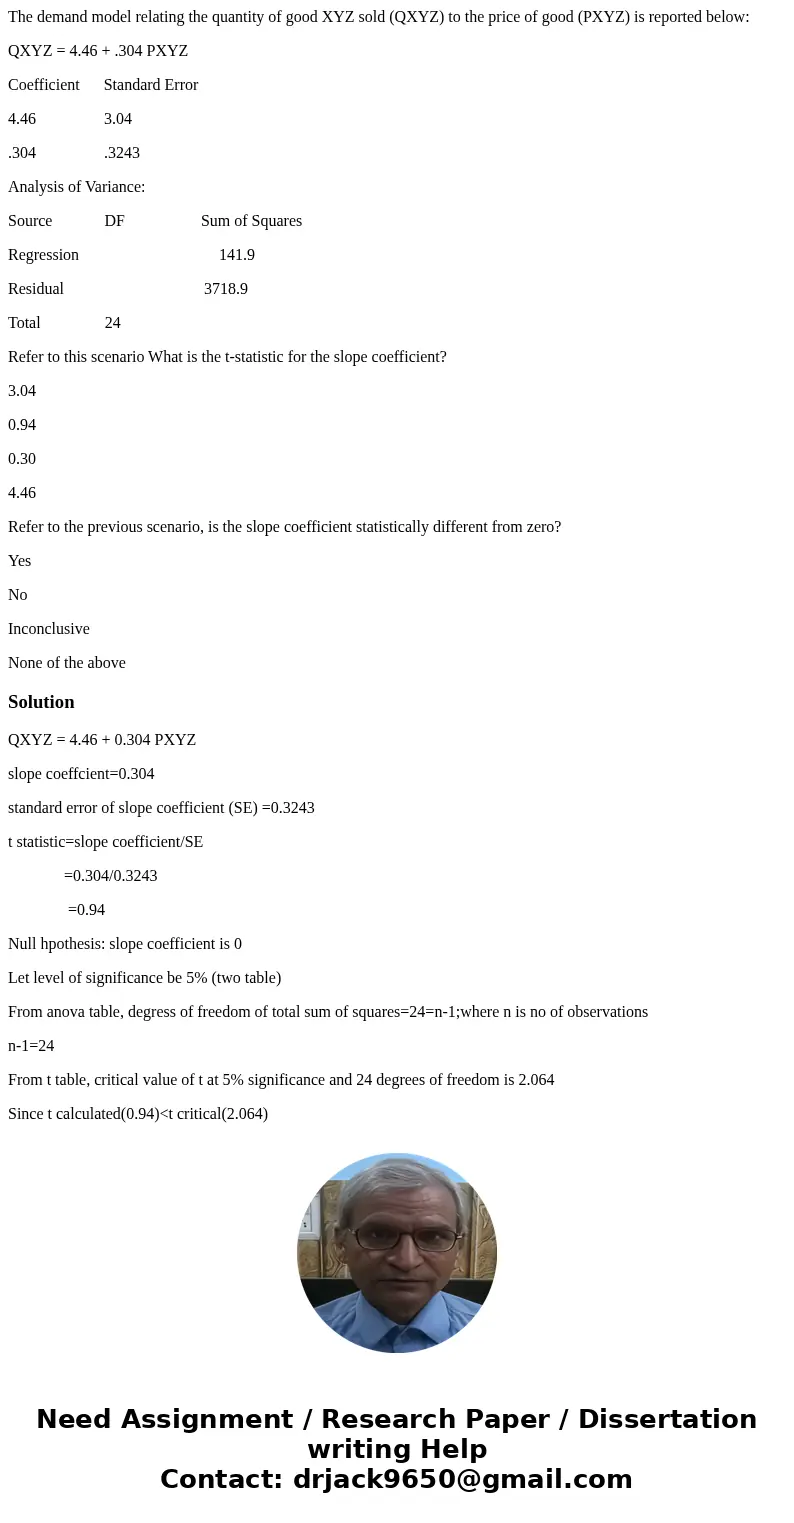
The demand model relating the quantity of good XYZ sold (QXYZ) to the price of good (PXYZ) is reported below:
QXYZ = 4.46 + .304 PXYZ
Coefficient Standard Error
4.46 3.04
.304 .3243
Analysis of Variance:
Source DF Sum of Squares
Regression 141.9
Residual 3718.9
Total 24
Refer to this scenario What is the t-statistic for the slope coefficient?
3.04
0.94
0.30
4.46
Refer to the previous scenario, is the slope coefficient statistically different from zero?
Yes
No
Inconclusive
None of the above
Solution
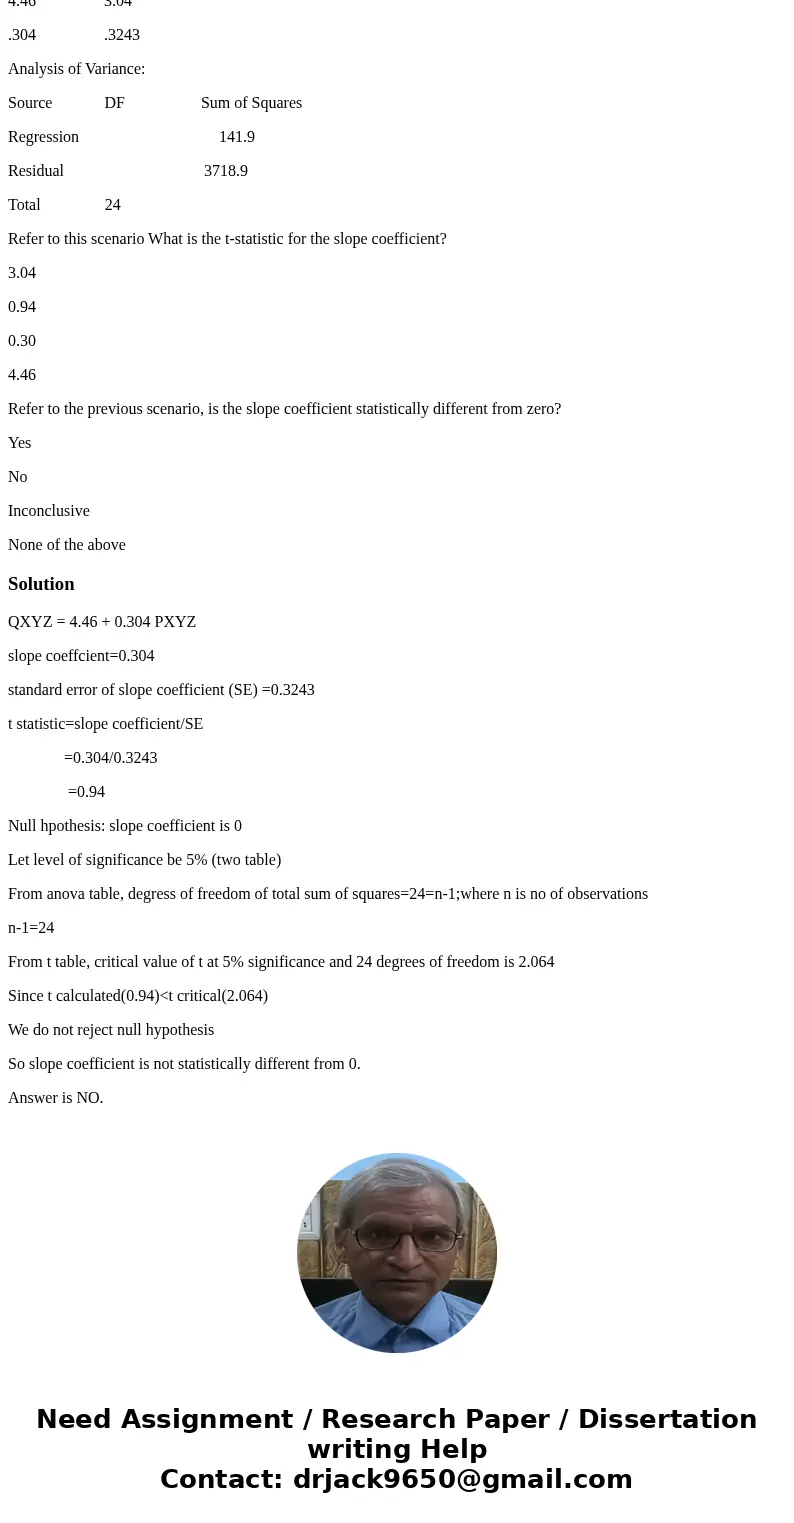
QXYZ = 4.46 + 0.304 PXYZ
slope coeffcient=0.304
standard error of slope coefficient (SE) =0.3243
t statistic=slope coefficient/SE
=0.304/0.3243
=0.94
Null hpothesis: slope coefficient is 0
Let level of significance be 5% (two table)
From anova table, degress of freedom of total sum of squares=24=n-1;where n is no of observations
n-1=24
From t table, critical value of t at 5% significance and 24 degrees of freedom is 2.064
Since t calculated(0.94)<t critical(2.064)
We do not reject null hypothesis
So slope coefficient is not statistically different from 0.
Answer is NO.


 Homework Sourse