The college is planning to add a food vender in the student
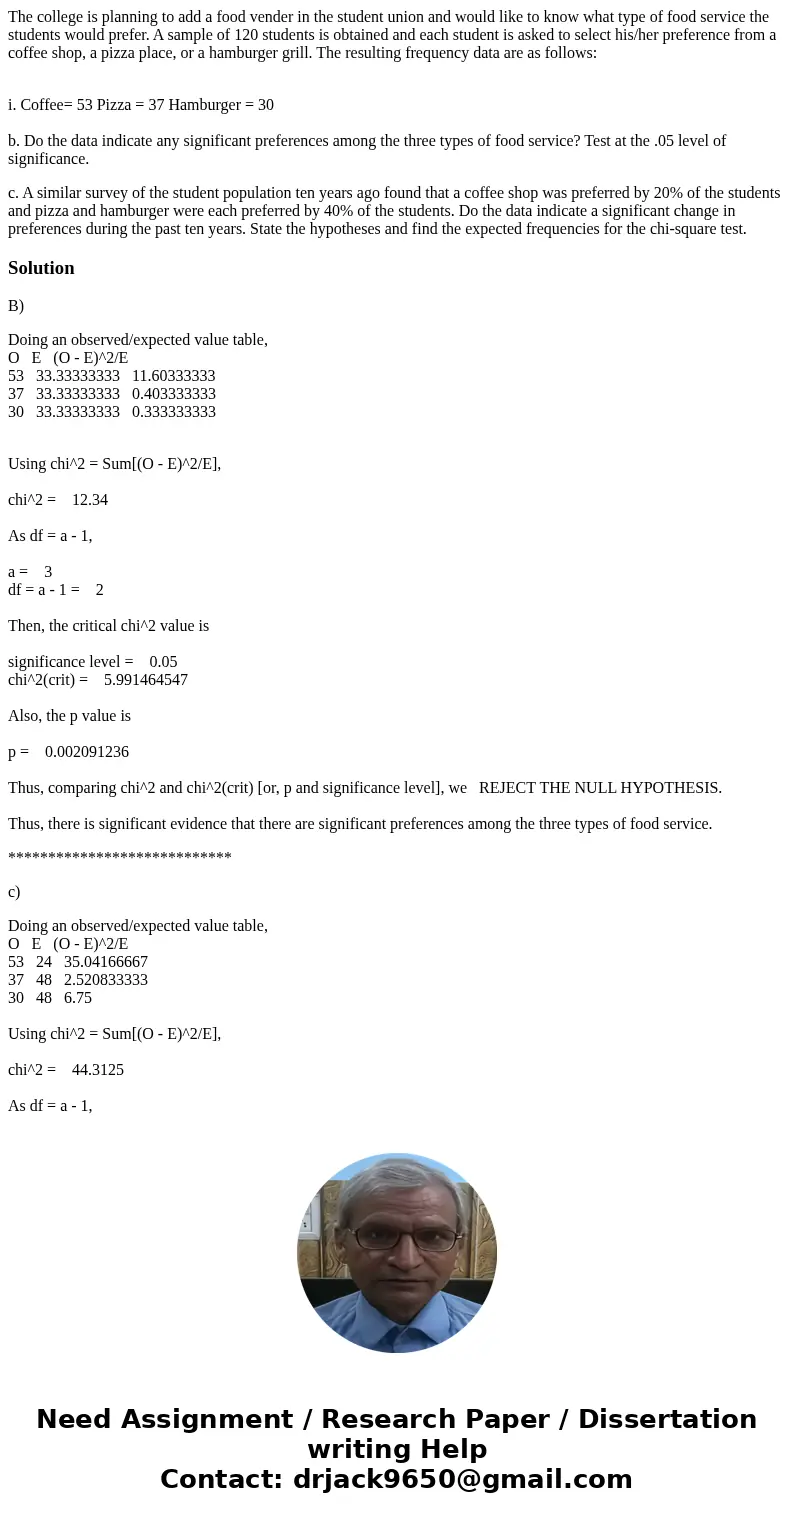
The college is planning to add a food vender in the student union and would like to know what type of food service the students would prefer. A sample of 120 students is obtained and each student is asked to select his/her preference from a coffee shop, a pizza place, or a hamburger grill. The resulting frequency data are as follows:
i. Coffee= 53 Pizza = 37 Hamburger = 30
b. Do the data indicate any significant preferences among the three types of food service? Test at the .05 level of significance.
c. A similar survey of the student population ten years ago found that a coffee shop was preferred by 20% of the students and pizza and hamburger were each preferred by 40% of the students. Do the data indicate a significant change in preferences during the past ten years. State the hypotheses and find the expected frequencies for the chi-square test.
Solution
B)
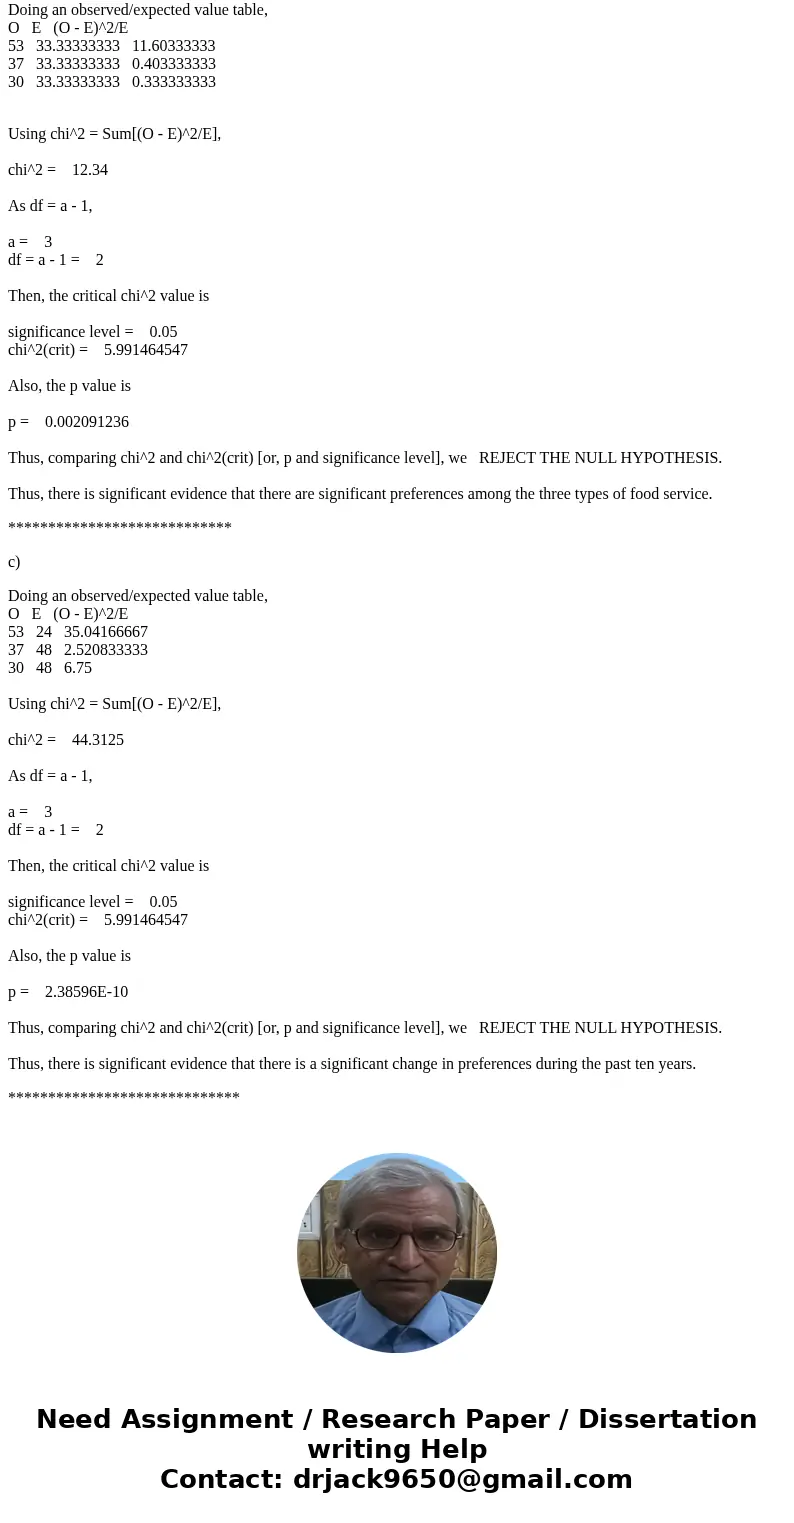
Doing an observed/expected value table,
O E (O - E)^2/E
53 33.33333333 11.60333333
37 33.33333333 0.403333333
30 33.33333333 0.333333333
Using chi^2 = Sum[(O - E)^2/E],
chi^2 = 12.34
As df = a - 1,
a = 3
df = a - 1 = 2
Then, the critical chi^2 value is
significance level = 0.05
chi^2(crit) = 5.991464547
Also, the p value is
p = 0.002091236
Thus, comparing chi^2 and chi^2(crit) [or, p and significance level], we REJECT THE NULL HYPOTHESIS.
Thus, there is significant evidence that there are significant preferences among the three types of food service.
****************************
c)
Doing an observed/expected value table,
O E (O - E)^2/E
53 24 35.04166667
37 48 2.520833333
30 48 6.75
Using chi^2 = Sum[(O - E)^2/E],
chi^2 = 44.3125
As df = a - 1,
a = 3
df = a - 1 = 2
Then, the critical chi^2 value is
significance level = 0.05
chi^2(crit) = 5.991464547
Also, the p value is
p = 2.38596E-10
Thus, comparing chi^2 and chi^2(crit) [or, p and significance level], we REJECT THE NULL HYPOTHESIS.
Thus, there is significant evidence that there is a significant change in preferences during the past ten years.
*****************************


 Homework Sourse