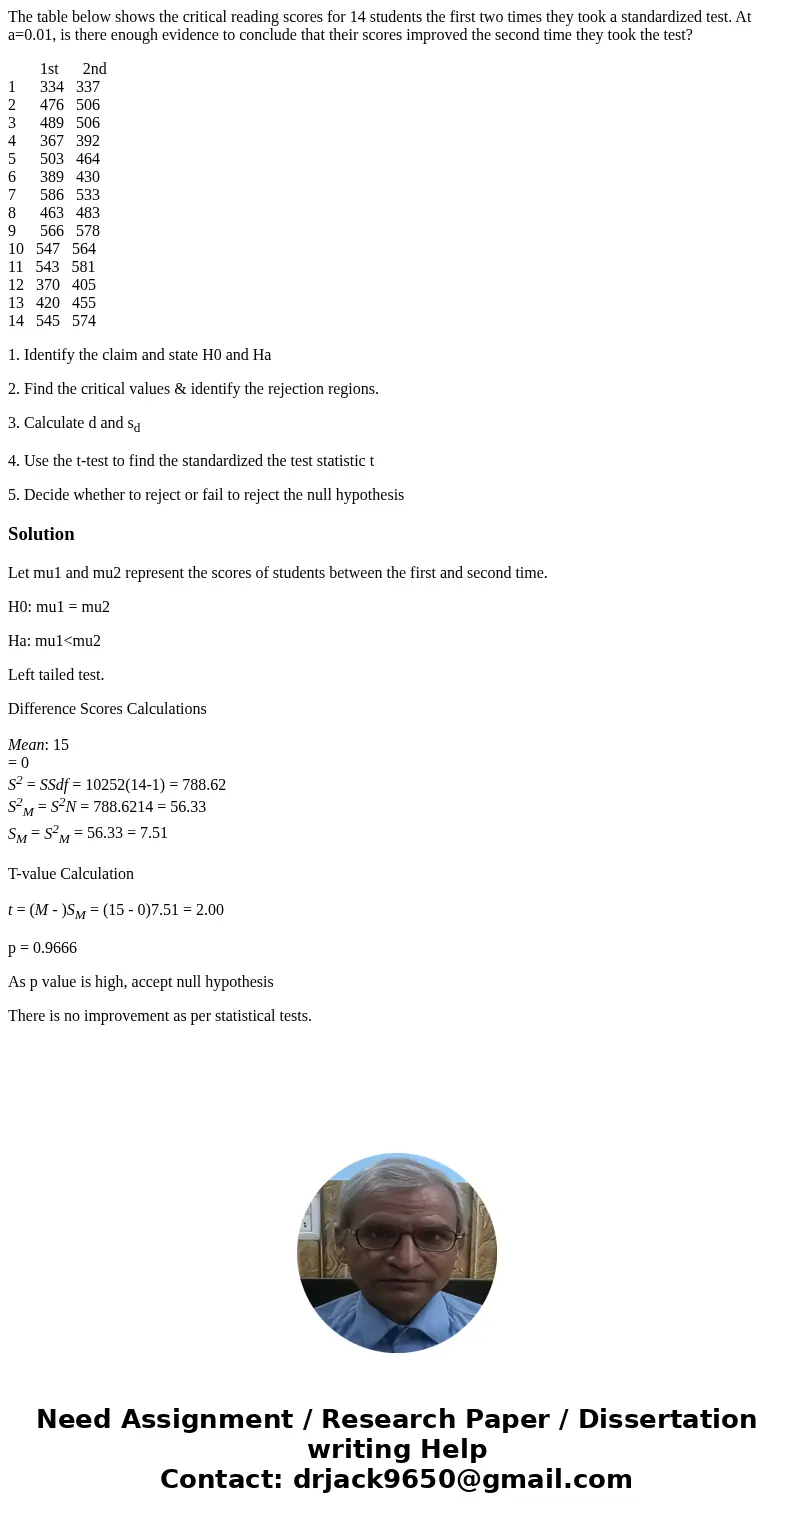
The table below shows the critical reading scores for 14 stu
The table below shows the critical reading scores for 14 students the first two times they took a standardized test. At a=0.01, is there enough evidence to conclude that their scores improved the second time they took the test?
1st 2nd
1 334 337
2 476 506
3 489 506
4 367 392
5 503 464
6 389 430
7 586 533
8 463 483
9 566 578
10 547 564
11 543 581
12 370 405
13 420 455
14 545 574
1. Identify the claim and state H0 and Ha
2. Find the critical values & identify the rejection regions.
3. Calculate d and sd
4. Use the t-test to find the standardized the test statistic t
5. Decide whether to reject or fail to reject the null hypothesis
Solution
Let mu1 and mu2 represent the scores of students between the first and second time.
H0: mu1 = mu2
Ha: mu1<mu2
Left tailed test.
Difference Scores Calculations
Mean: 15
= 0
S2 = SSdf = 10252(14-1) = 788.62
S2M = S2N = 788.6214 = 56.33
SM = S2M = 56.33 = 7.51
T-value Calculation
t = (M - )SM = (15 - 0)7.51 = 2.00
p = 0.9666
As p value is high, accept null hypothesis
There is no improvement as per statistical tests.

 Homework Sourse