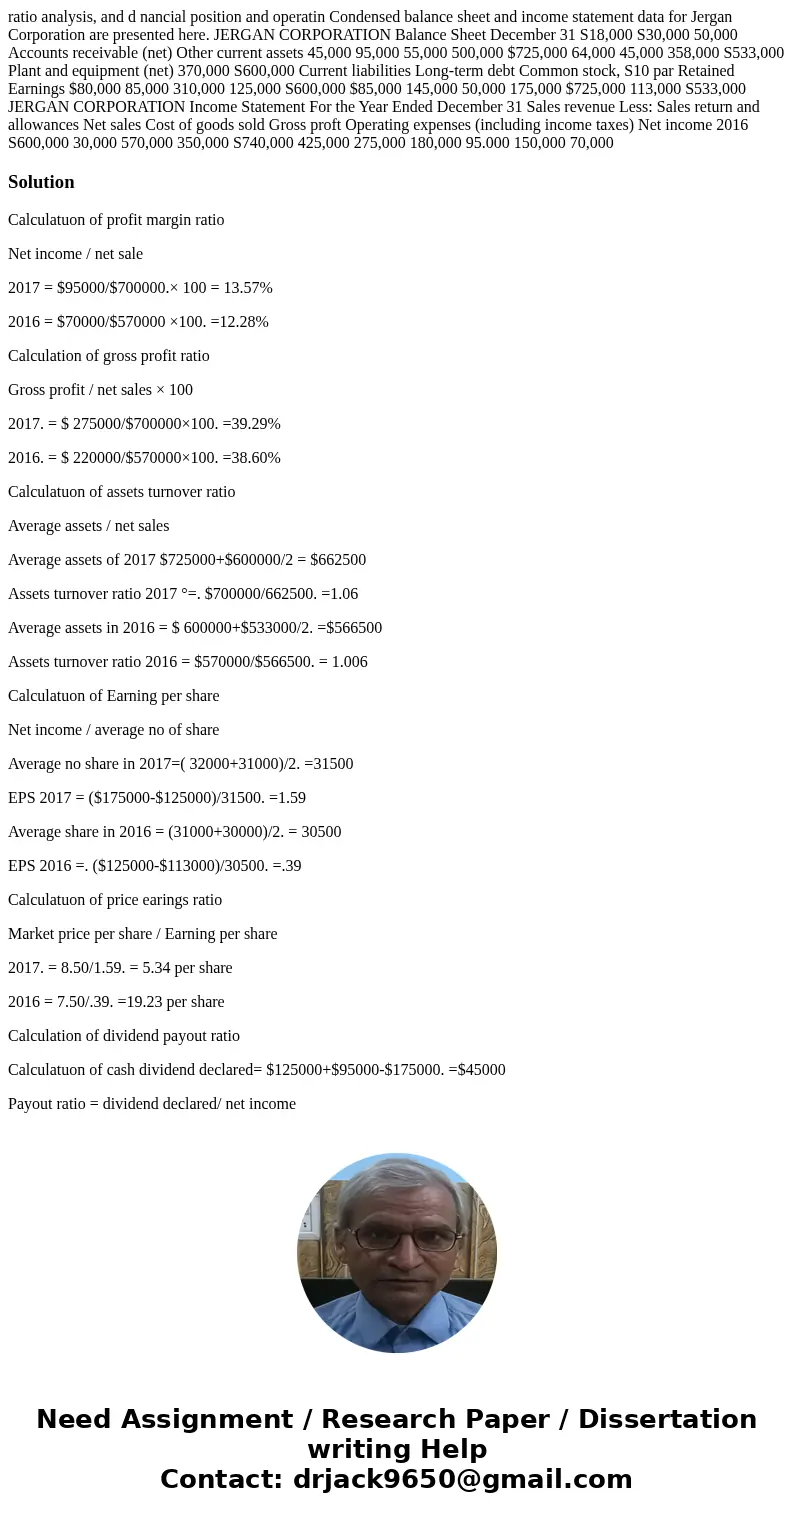
ratio analysis and d nancial position and operatin Condensed
Solution
Calculatuon of profit margin ratio
Net income / net sale
2017 = $95000/$700000.× 100 = 13.57%
2016 = $70000/$570000 ×100. =12.28%
Calculation of gross profit ratio
Gross profit / net sales × 100
2017. = $ 275000/$700000×100. =39.29%
2016. = $ 220000/$570000×100. =38.60%
Calculatuon of assets turnover ratio
Average assets / net sales
Average assets of 2017 $725000+$600000/2 = $662500
Assets turnover ratio 2017 °=. $700000/662500. =1.06
Average assets in 2016 = $ 600000+$533000/2. =$566500
Assets turnover ratio 2016 = $570000/$566500. = 1.006
Calculatuon of Earning per share
Net income / average no of share
Average no share in 2017=( 32000+31000)/2. =31500
EPS 2017 = ($175000-$125000)/31500. =1.59
Average share in 2016 = (31000+30000)/2. = 30500
EPS 2016 =. ($125000-$113000)/30500. =.39
Calculatuon of price earings ratio
Market price per share / Earning per share
2017. = 8.50/1.59. = 5.34 per share
2016 = 7.50/.39. =19.23 per share
Calculation of dividend payout ratio
Calculatuon of cash dividend declared= $125000+$95000-$175000. =$45000
Payout ratio = dividend declared/ net income
Payout in 2017 = $45000/$95000. =.47 per share
Cash dividend 2016. =$113000+$ 70000-$125000. =$58000
Pay out ratio 2016 =. $58000/$70000. = .83 per share
Debt to assets ratio
Total debt / total assets
Total debt 2017 = $85000+$145000. = $230000
Debt to assets ratio 2017. =$230000/725000. =.32
Total debt in 2016. =. $80000+$85000. = $165000
Debt to assets ratio 2016. =$165000/$600000. =.275


 Homework Sourse