The consumption of turkey in the United States can be catego
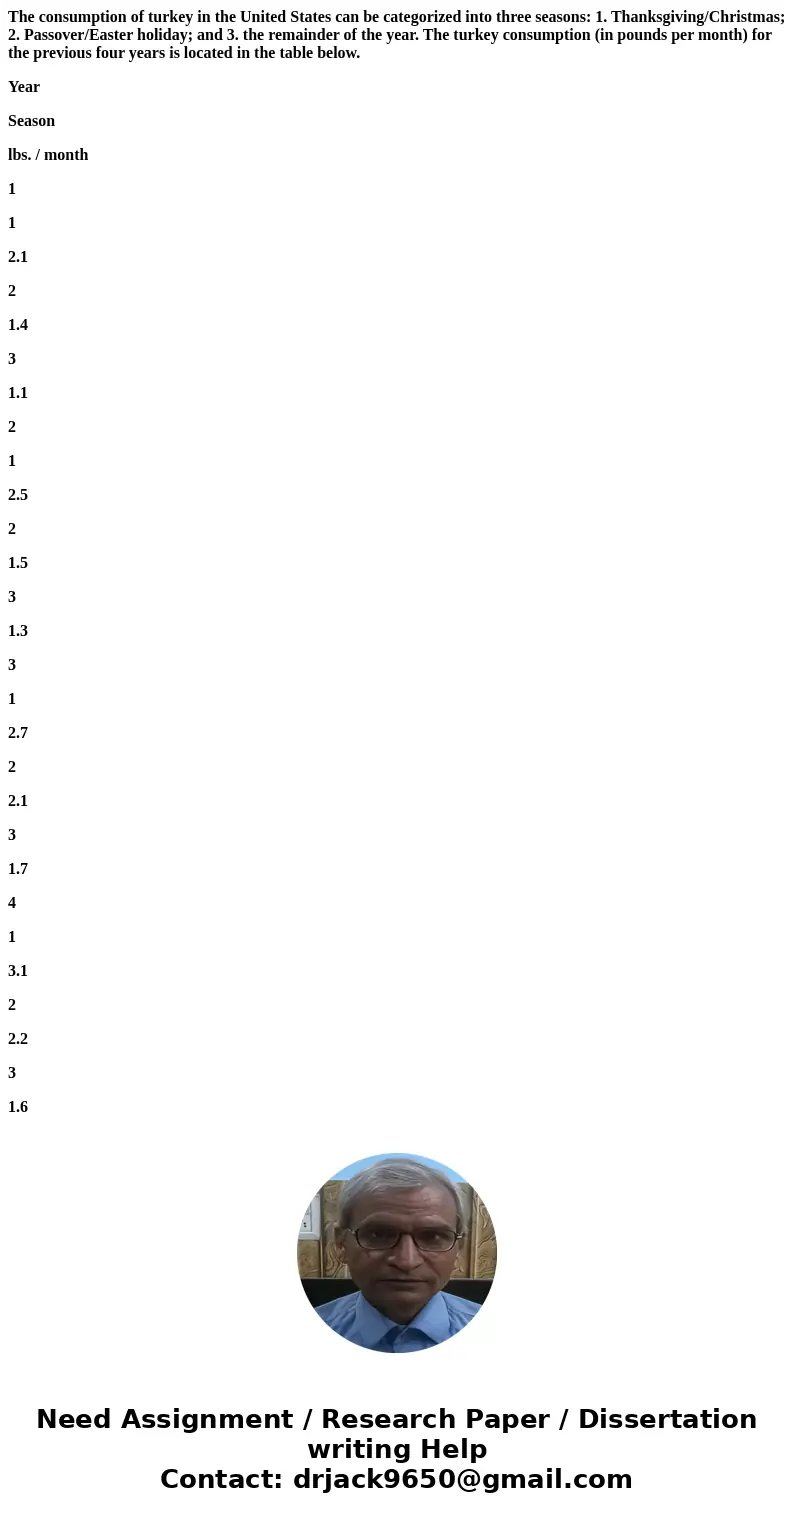
The consumption of turkey in the United States can be categorized into three seasons: 1. Thanksgiving/Christmas; 2. Passover/Easter holiday; and 3. the remainder of the year. The turkey consumption (in pounds per month) for the previous four years is located in the table below.
Year
Season
lbs. / month
1
1
2.1
2
1.4
3
1.1
2
1
2.5
2
1.5
3
1.3
3
1
2.7
2
2.1
3
1.7
4
1
3.1
2
2.2
3
1.6
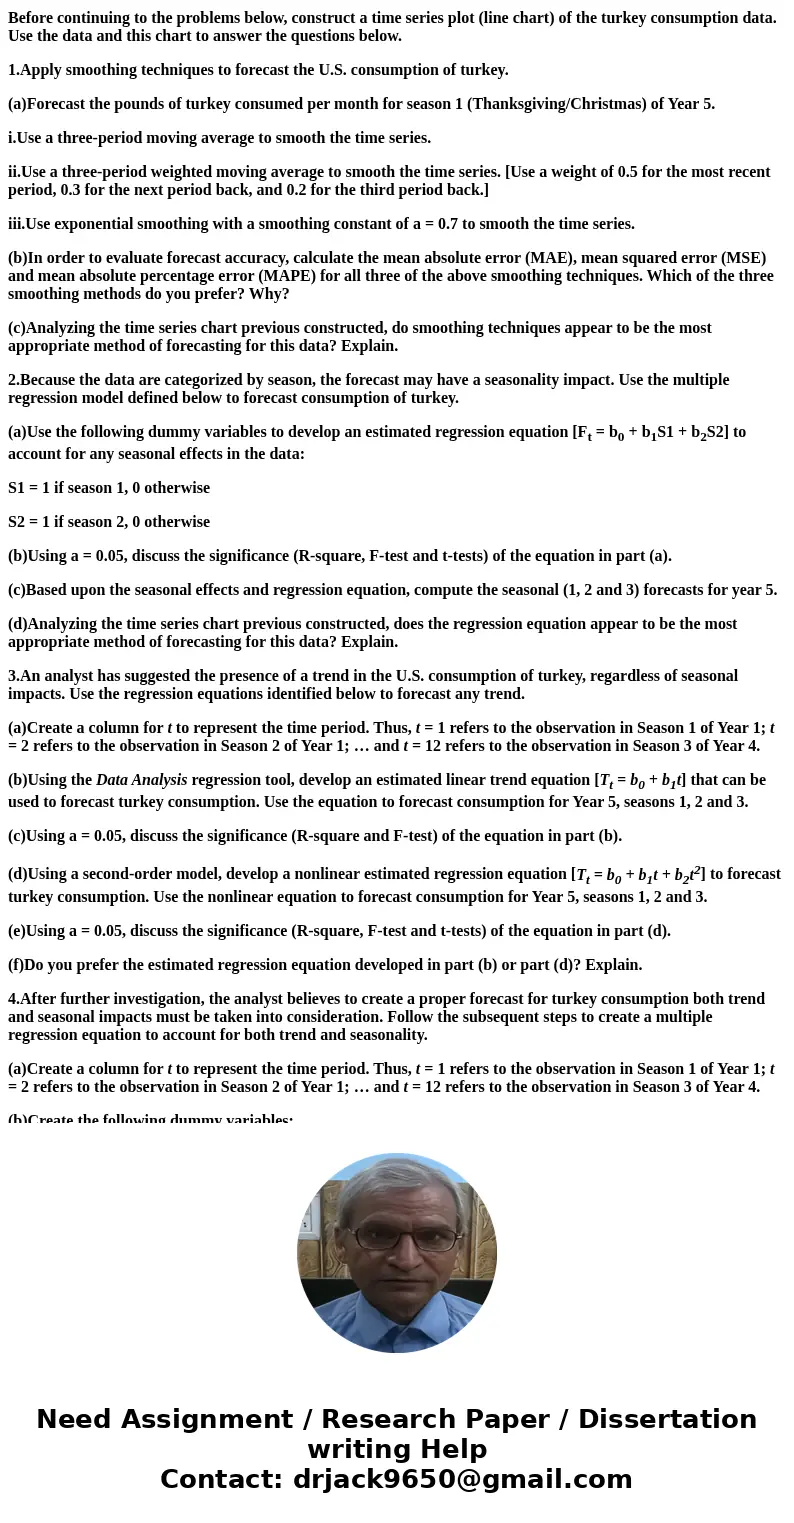
Before continuing to the problems below, construct a time series plot (line chart) of the turkey consumption data. Use the data and this chart to answer the questions below.
1.Apply smoothing techniques to forecast the U.S. consumption of turkey.
(a)Forecast the pounds of turkey consumed per month for season 1 (Thanksgiving/Christmas) of Year 5.
i.Use a three-period moving average to smooth the time series.
ii.Use a three-period weighted moving average to smooth the time series. [Use a weight of 0.5 for the most recent period, 0.3 for the next period back, and 0.2 for the third period back.]
iii.Use exponential smoothing with a smoothing constant of a = 0.7 to smooth the time series.
(b)In order to evaluate forecast accuracy, calculate the mean absolute error (MAE), mean squared error (MSE) and mean absolute percentage error (MAPE) for all three of the above smoothing techniques. Which of the three smoothing methods do you prefer? Why?
(c)Analyzing the time series chart previous constructed, do smoothing techniques appear to be the most appropriate method of forecasting for this data? Explain.
2.Because the data are categorized by season, the forecast may have a seasonality impact. Use the multiple regression model defined below to forecast consumption of turkey.
(a)Use the following dummy variables to develop an estimated regression equation [Ft = b0 + b1S1 + b2S2] to account for any seasonal effects in the data:
S1 = 1 if season 1, 0 otherwise
S2 = 1 if season 2, 0 otherwise
(b)Using a = 0.05, discuss the significance (R-square, F-test and t-tests) of the equation in part (a).
(c)Based upon the seasonal effects and regression equation, compute the seasonal (1, 2 and 3) forecasts for year 5.
(d)Analyzing the time series chart previous constructed, does the regression equation appear to be the most appropriate method of forecasting for this data? Explain.
3.An analyst has suggested the presence of a trend in the U.S. consumption of turkey, regardless of seasonal impacts. Use the regression equations identified below to forecast any trend.
(a)Create a column for t to represent the time period. Thus, t = 1 refers to the observation in Season 1 of Year 1; t = 2 refers to the observation in Season 2 of Year 1; … and t = 12 refers to the observation in Season 3 of Year 4.
(b)Using the Data Analysis regression tool, develop an estimated linear trend equation [Tt = b0 + b1t] that can be used to forecast turkey consumption. Use the equation to forecast consumption for Year 5, seasons 1, 2 and 3.
(c)Using a = 0.05, discuss the significance (R-square and F-test) of the equation in part (b).
(d)Using a second-order model, develop a nonlinear estimated regression equation [Tt = b0 + b1t + b2t2] to forecast turkey consumption. Use the nonlinear equation to forecast consumption for Year 5, seasons 1, 2 and 3.
(e)Using a = 0.05, discuss the significance (R-square, F-test and t-tests) of the equation in part (d).
(f)Do you prefer the estimated regression equation developed in part (b) or part (d)? Explain.
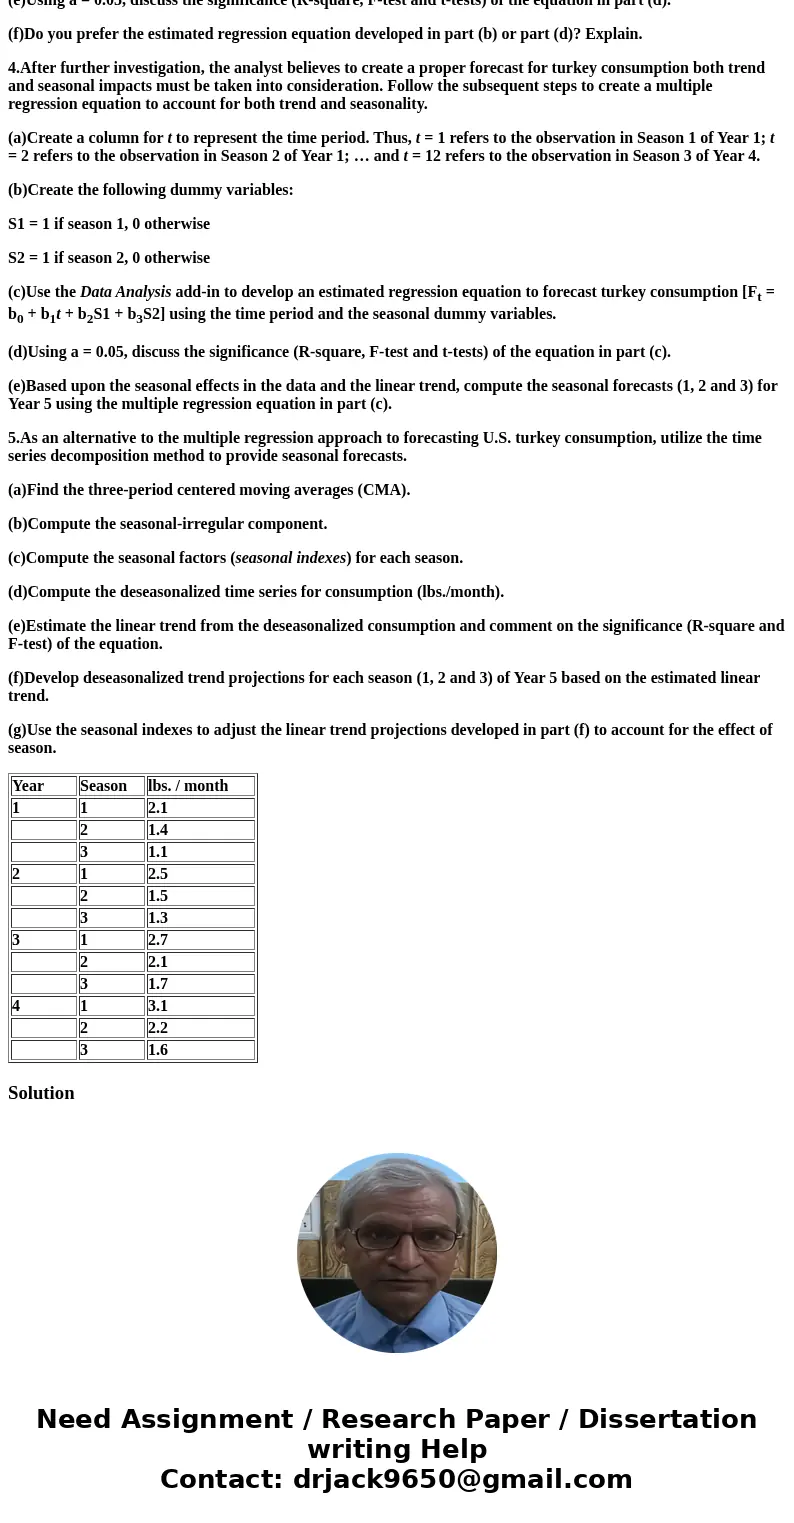
4.After further investigation, the analyst believes to create a proper forecast for turkey consumption both trend and seasonal impacts must be taken into consideration. Follow the subsequent steps to create a multiple regression equation to account for both trend and seasonality.
(a)Create a column for t to represent the time period. Thus, t = 1 refers to the observation in Season 1 of Year 1; t = 2 refers to the observation in Season 2 of Year 1; … and t = 12 refers to the observation in Season 3 of Year 4.
(b)Create the following dummy variables:
S1 = 1 if season 1, 0 otherwise
S2 = 1 if season 2, 0 otherwise
(c)Use the Data Analysis add-in to develop an estimated regression equation to forecast turkey consumption [Ft = b0 + b1t + b2S1 + b3S2] using the time period and the seasonal dummy variables.
(d)Using a = 0.05, discuss the significance (R-square, F-test and t-tests) of the equation in part (c).
(e)Based upon the seasonal effects in the data and the linear trend, compute the seasonal forecasts (1, 2 and 3) for Year 5 using the multiple regression equation in part (c).
5.As an alternative to the multiple regression approach to forecasting U.S. turkey consumption, utilize the time series decomposition method to provide seasonal forecasts.
(a)Find the three-period centered moving averages (CMA).
(b)Compute the seasonal-irregular component.
(c)Compute the seasonal factors (seasonal indexes) for each season.
(d)Compute the deseasonalized time series for consumption (lbs./month).
(e)Estimate the linear trend from the deseasonalized consumption and comment on the significance (R-square and F-test) of the equation.
(f)Develop deseasonalized trend projections for each season (1, 2 and 3) of Year 5 based on the estimated linear trend.
(g)Use the seasonal indexes to adjust the linear trend projections developed in part (f) to account for the effect of season.
| Year | Season | lbs. / month |
| 1 | 1 | 2.1 |
| 2 | 1.4 | |
| 3 | 1.1 | |
| 2 | 1 | 2.5 |
| 2 | 1.5 | |
| 3 | 1.3 | |
| 3 | 1 | 2.7 |
| 2 | 2.1 | |
| 3 | 1.7 | |
| 4 | 1 | 3.1 |
| 2 | 2.2 | |
| 3 | 1.6 |
Solution


 Homework Sourse