The manager of Moores catalog showroom is trying to predict
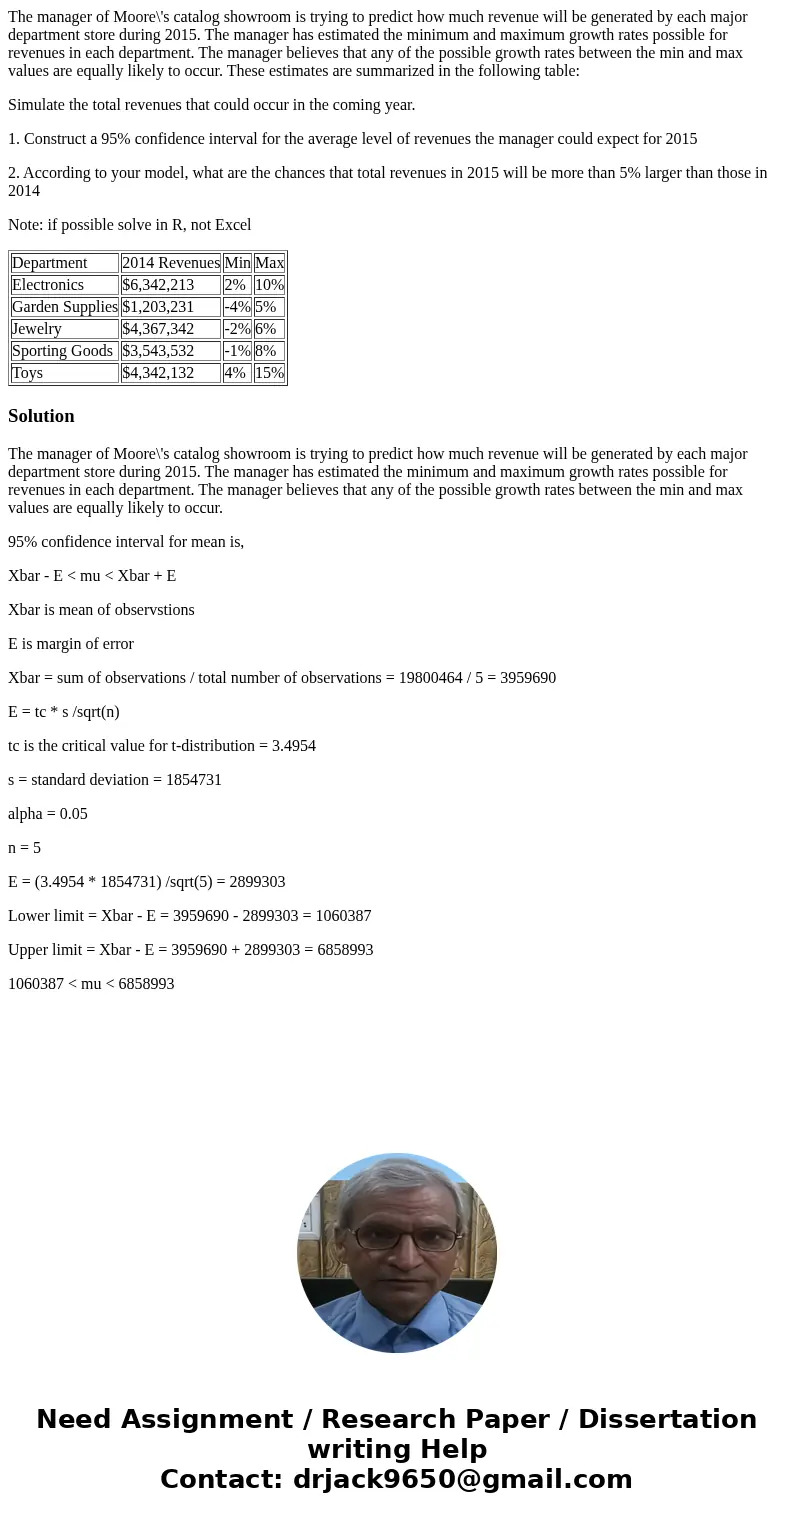
The manager of Moore\'s catalog showroom is trying to predict how much revenue will be generated by each major department store during 2015. The manager has estimated the minimum and maximum growth rates possible for revenues in each department. The manager believes that any of the possible growth rates between the min and max values are equally likely to occur. These estimates are summarized in the following table:
Simulate the total revenues that could occur in the coming year.
1. Construct a 95% confidence interval for the average level of revenues the manager could expect for 2015
2. According to your model, what are the chances that total revenues in 2015 will be more than 5% larger than those in 2014
Note: if possible solve in R, not Excel
| Department | 2014 Revenues | Min | Max |
| Electronics | $6,342,213 | 2% | 10% |
| Garden Supplies | $1,203,231 | -4% | 5% |
| Jewelry | $4,367,342 | -2% | 6% |
| Sporting Goods | $3,543,532 | -1% | 8% |
| Toys | $4,342,132 | 4% | 15% |
Solution
The manager of Moore\'s catalog showroom is trying to predict how much revenue will be generated by each major department store during 2015. The manager has estimated the minimum and maximum growth rates possible for revenues in each department. The manager believes that any of the possible growth rates between the min and max values are equally likely to occur.
95% confidence interval for mean is,
Xbar - E < mu < Xbar + E
Xbar is mean of observstions
E is margin of error
Xbar = sum of observations / total number of observations = 19800464 / 5 = 3959690
E = tc * s /sqrt(n)
tc is the critical value for t-distribution = 3.4954
s = standard deviation = 1854731
alpha = 0.05
n = 5
E = (3.4954 * 1854731) /sqrt(5) = 2899303
Lower limit = Xbar - E = 3959690 - 2899303 = 1060387
Upper limit = Xbar - E = 3959690 + 2899303 = 6858993
1060387 < mu < 6858993

 Homework Sourse