The heights measured in inches of men aged 20 to 29 follow a
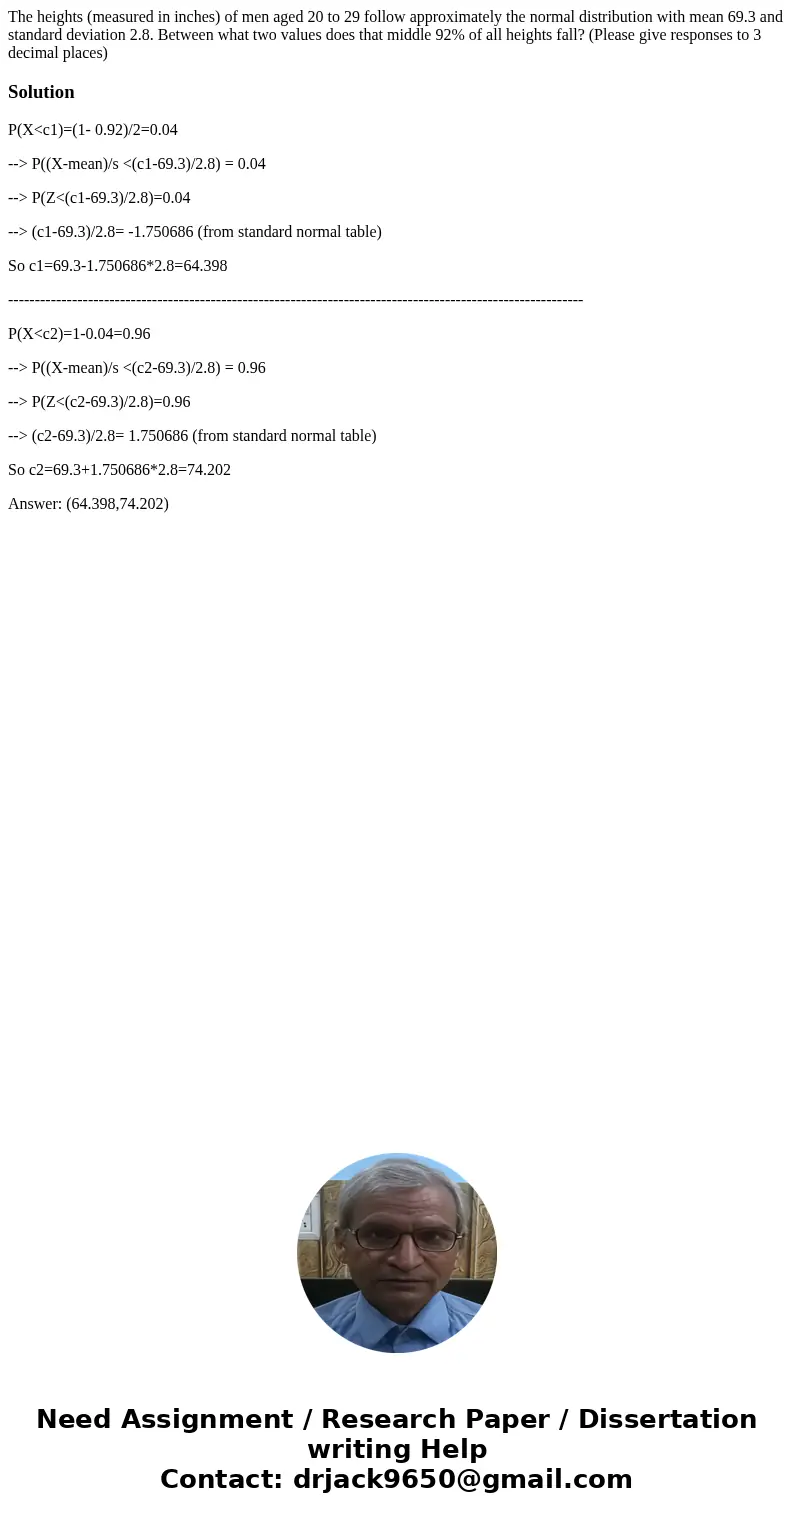
The heights (measured in inches) of men aged 20 to 29 follow approximately the normal distribution with mean 69.3 and standard deviation 2.8. Between what two values does that middle 92% of all heights fall? (Please give responses to 3 decimal places)
Solution
P(X<c1)=(1- 0.92)/2=0.04
--> P((X-mean)/s <(c1-69.3)/2.8) = 0.04
--> P(Z<(c1-69.3)/2.8)=0.04
--> (c1-69.3)/2.8= -1.750686 (from standard normal table)
So c1=69.3-1.750686*2.8=64.398
------------------------------------------------------------------------------------------------------------
P(X<c2)=1-0.04=0.96
--> P((X-mean)/s <(c2-69.3)/2.8) = 0.96
--> P(Z<(c2-69.3)/2.8)=0.96
--> (c2-69.3)/2.8= 1.750686 (from standard normal table)
So c2=69.3+1.750686*2.8=74.202
Answer: (64.398,74.202)

 Homework Sourse