Just answer DO NOT ELABORATE At the right are the number of
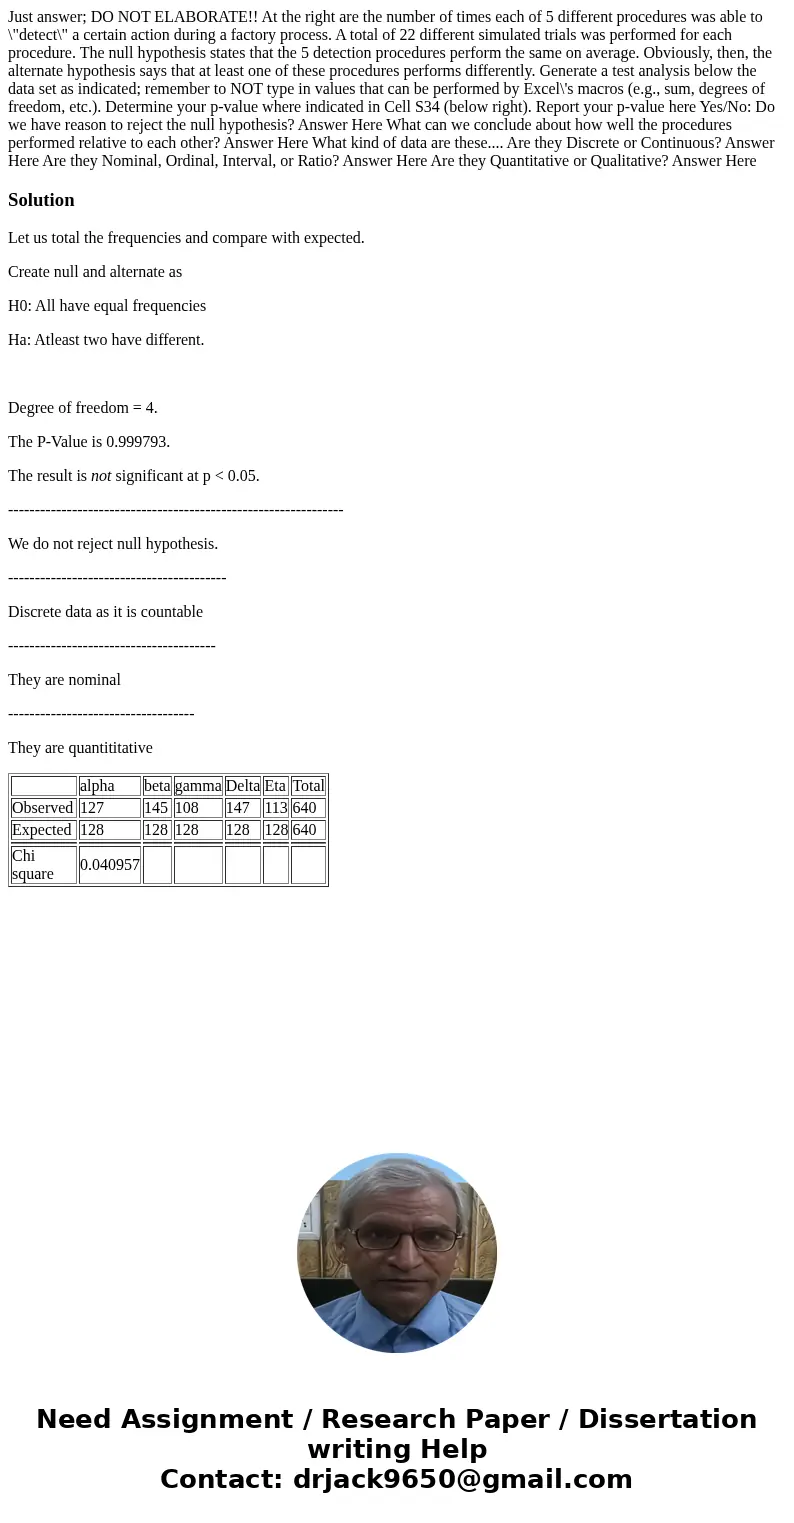
Just answer; DO NOT ELABORATE!! At the right are the number of times each of 5 different procedures was able to \"detect\" a certain action during a factory process. A total of 22 different simulated trials was performed for each procedure. The null hypothesis states that the 5 detection procedures perform the same on average. Obviously, then, the alternate hypothesis says that at least one of these procedures performs differently. Generate a test analysis below the data set as indicated; remember to NOT type in values that can be performed by Excel\'s macros (e.g., sum, degrees of freedom, etc.). Determine your p-value where indicated in Cell S34 (below right). Report your p-value here Yes/No: Do we have reason to reject the null hypothesis? Answer Here What can we conclude about how well the procedures performed relative to each other? Answer Here What kind of data are these.... Are they Discrete or Continuous? Answer Here Are they Nominal, Ordinal, Interval, or Ratio? Answer Here Are they Quantitative or Qualitative? Answer Here

Solution
Let us total the frequencies and compare with expected.
Create null and alternate as
H0: All have equal frequencies
Ha: Atleast two have different.
Degree of freedom = 4.
The P-Value is 0.999793.
The result is not significant at p < 0.05.
---------------------------------------------------------------
We do not reject null hypothesis.
-----------------------------------------
Discrete data as it is countable
---------------------------------------
They are nominal
-----------------------------------
They are quantititative
| alpha | beta | gamma | Delta | Eta | Total | |
| Observed | 127 | 145 | 108 | 147 | 113 | 640 |
| Expected | 128 | 128 | 128 | 128 | 128 | 640 |
| Chi square | 0.040957 | |

 Homework Sourse