The following table gives the percent of the US population h
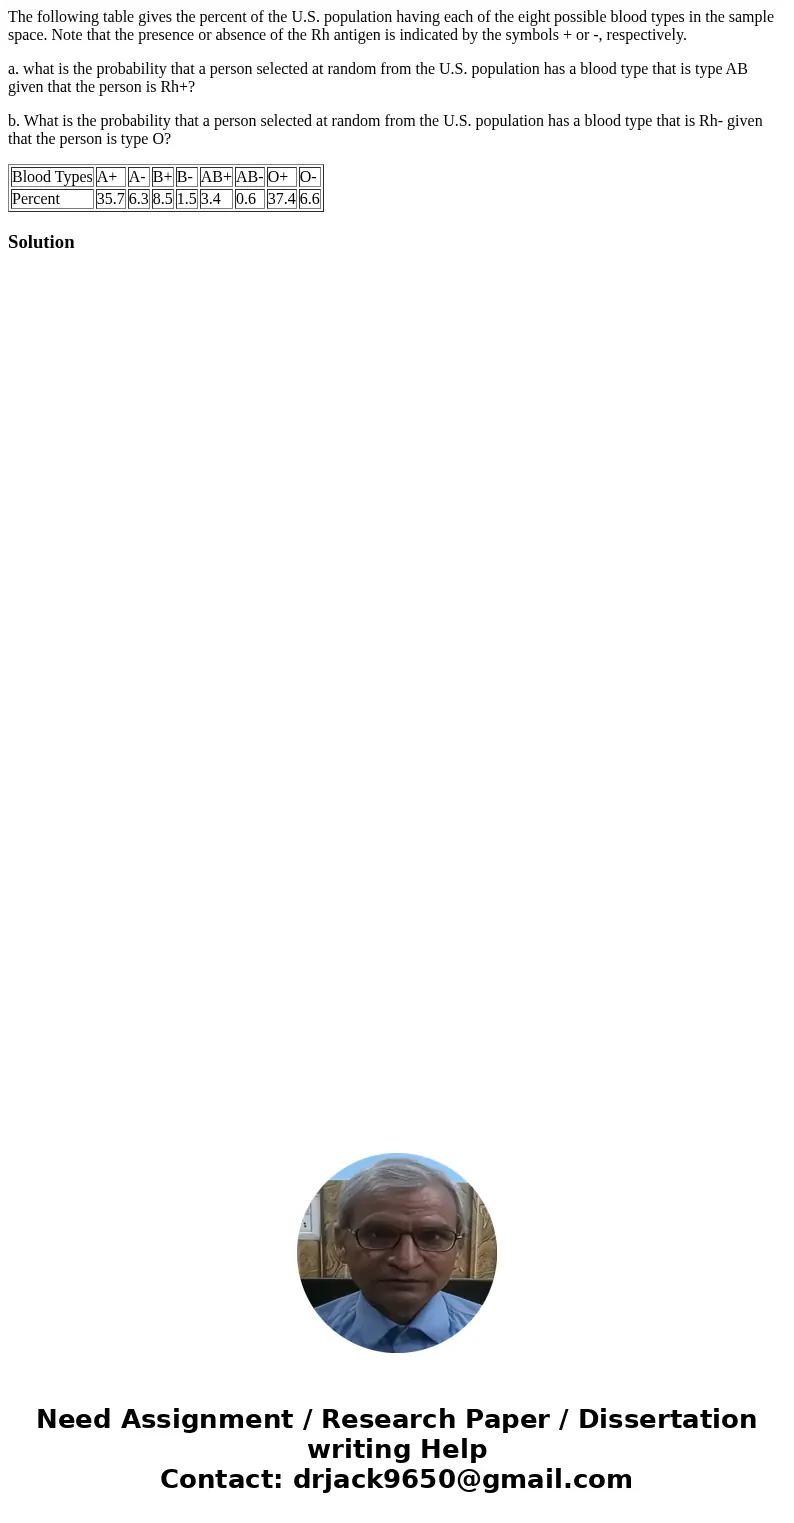
The following table gives the percent of the U.S. population having each of the eight possible blood types in the sample space. Note that the presence or absence of the Rh antigen is indicated by the symbols + or -, respectively.
a. what is the probability that a person selected at random from the U.S. population has a blood type that is type AB given that the person is Rh+?
b. What is the probability that a person selected at random from the U.S. population has a blood type that is Rh- given that the person is type O?
| Blood Types | A+ | A- | B+ | B- | AB+ | AB- | O+ | O- |
| Percent | 35.7 | 6.3 | 8.5 | 1.5 | 3.4 | 0.6 | 37.4 | 6.6 |
Solution

 Homework Sourse