The population is normally distributed A sample produces the
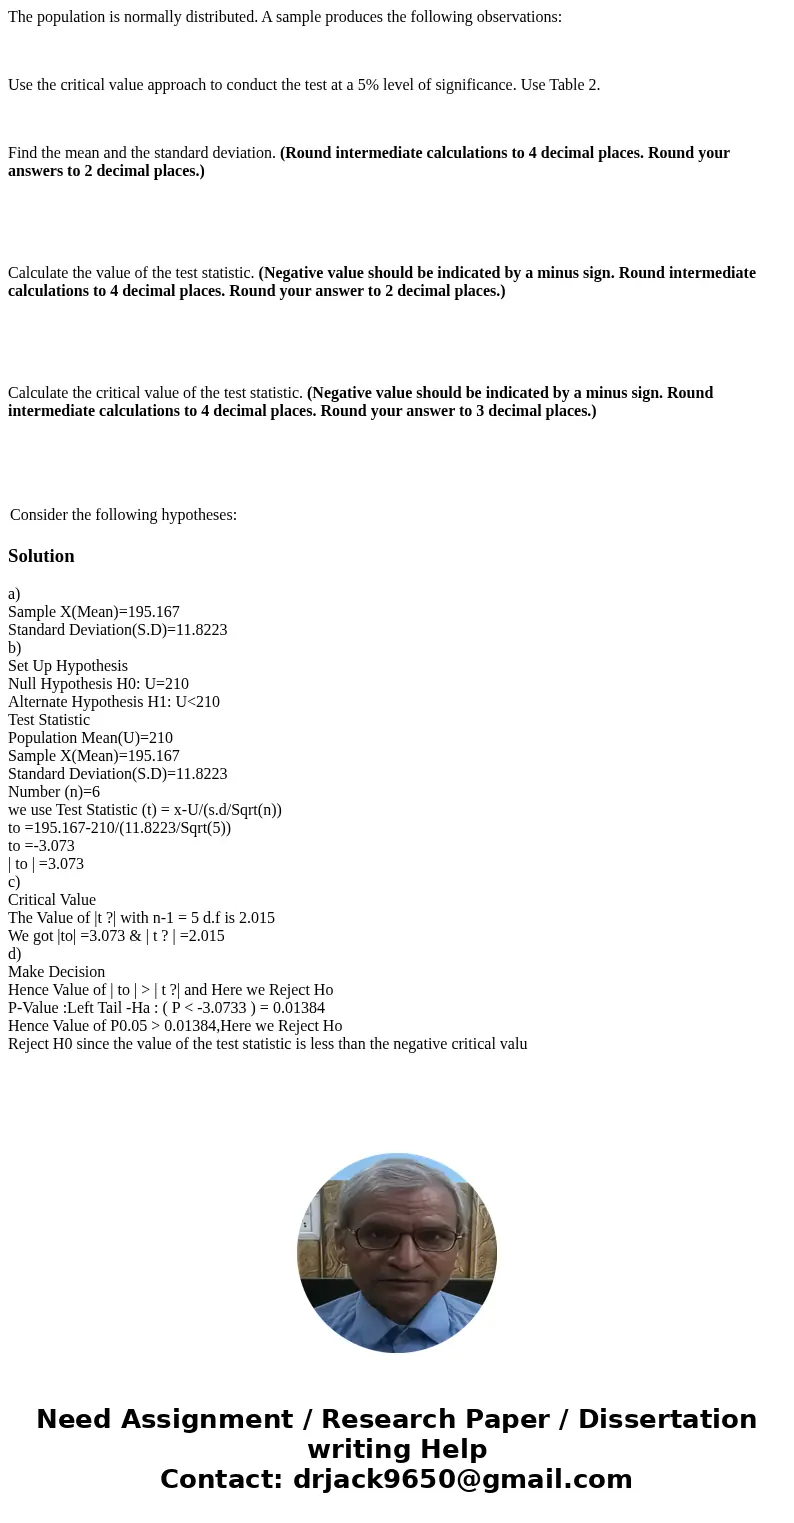
The population is normally distributed. A sample produces the following observations:
Use the critical value approach to conduct the test at a 5% level of significance. Use Table 2.
Find the mean and the standard deviation. (Round intermediate calculations to 4 decimal places. Round your answers to 2 decimal places.)
Calculate the value of the test statistic. (Negative value should be indicated by a minus sign. Round intermediate calculations to 4 decimal places. Round your answer to 2 decimal places.)
Calculate the critical value of the test statistic. (Negative value should be indicated by a minus sign. Round intermediate calculations to 4 decimal places. Round your answer to 3 decimal places.)
| Consider the following hypotheses: |
Solution
a)
Sample X(Mean)=195.167
Standard Deviation(S.D)=11.8223
b)
Set Up Hypothesis
Null Hypothesis H0: U=210
Alternate Hypothesis H1: U<210
Test Statistic
Population Mean(U)=210
Sample X(Mean)=195.167
Standard Deviation(S.D)=11.8223
Number (n)=6
we use Test Statistic (t) = x-U/(s.d/Sqrt(n))
to =195.167-210/(11.8223/Sqrt(5))
to =-3.073
| to | =3.073
c)
Critical Value
The Value of |t ?| with n-1 = 5 d.f is 2.015
We got |to| =3.073 & | t ? | =2.015
d)
Make Decision
Hence Value of | to | > | t ?| and Here we Reject Ho
P-Value :Left Tail -Ha : ( P < -3.0733 ) = 0.01384
Hence Value of P0.05 > 0.01384,Here we Reject Ho
Reject H0 since the value of the test statistic is less than the negative critical valu

 Homework Sourse