Perform an ABC analysis and identify A B and C class items u
Perform an ABC analysis and identify A, B and C class items using 80% and 95% as cut-off points. Discuss if you would consider any adjustments to these cut-off points to identify A, B, and C items. Which items would you re-classify? How would you re-classify them? Why?
Solution
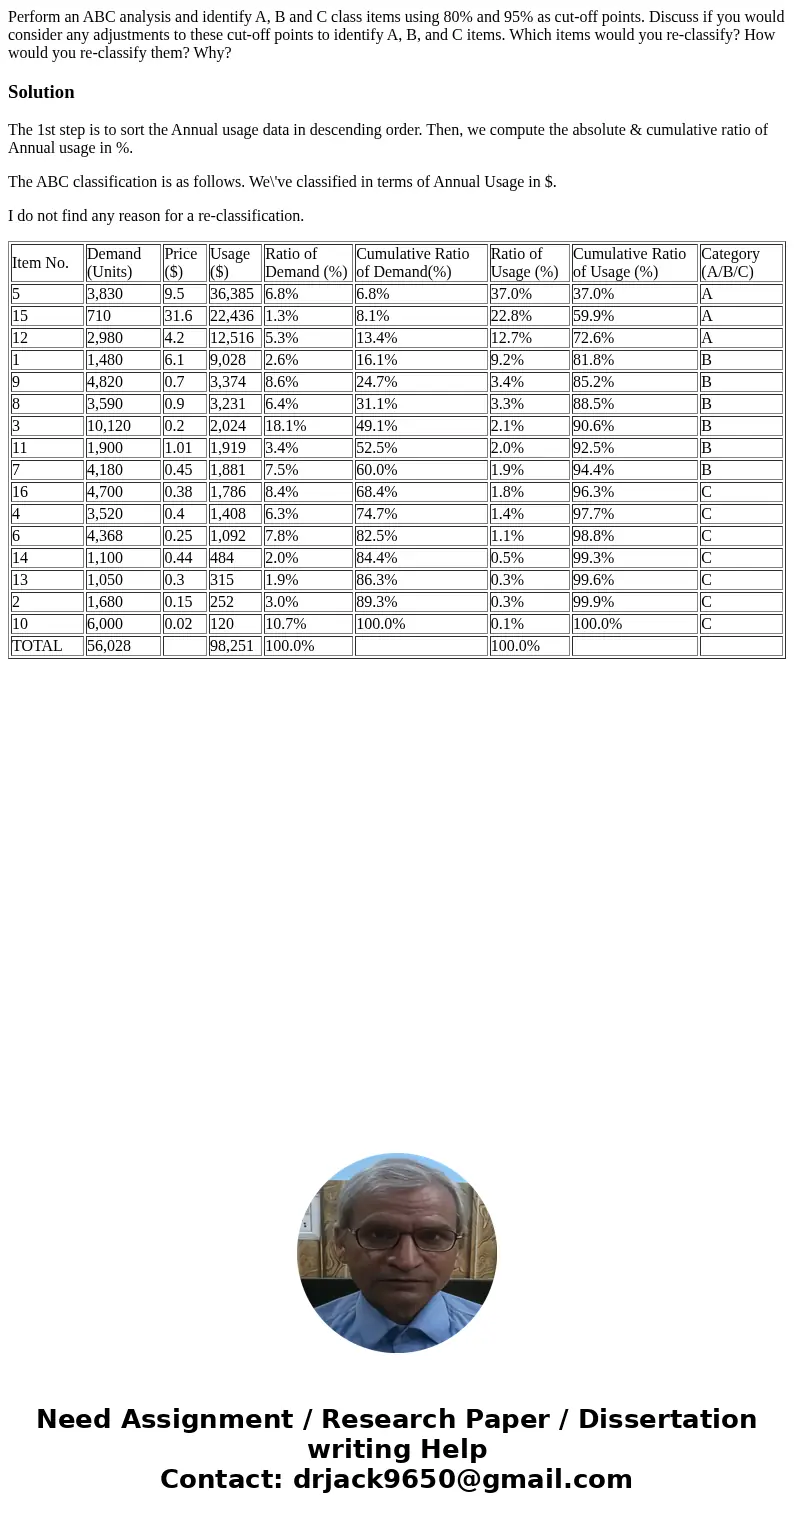
The 1st step is to sort the Annual usage data in descending order. Then, we compute the absolute & cumulative ratio of Annual usage in %.
The ABC classification is as follows. We\'ve classified in terms of Annual Usage in $.
I do not find any reason for a re-classification.
| Item No. | Demand (Units) | Price ($) | Usage ($) | Ratio of Demand (%) | Cumulative Ratio of Demand(%) | Ratio of Usage (%) | Cumulative Ratio of Usage (%) | Category (A/B/C) |
| 5 | 3,830 | 9.5 | 36,385 | 6.8% | 6.8% | 37.0% | 37.0% | A |
| 15 | 710 | 31.6 | 22,436 | 1.3% | 8.1% | 22.8% | 59.9% | A |
| 12 | 2,980 | 4.2 | 12,516 | 5.3% | 13.4% | 12.7% | 72.6% | A |
| 1 | 1,480 | 6.1 | 9,028 | 2.6% | 16.1% | 9.2% | 81.8% | B |
| 9 | 4,820 | 0.7 | 3,374 | 8.6% | 24.7% | 3.4% | 85.2% | B |
| 8 | 3,590 | 0.9 | 3,231 | 6.4% | 31.1% | 3.3% | 88.5% | B |
| 3 | 10,120 | 0.2 | 2,024 | 18.1% | 49.1% | 2.1% | 90.6% | B |
| 11 | 1,900 | 1.01 | 1,919 | 3.4% | 52.5% | 2.0% | 92.5% | B |
| 7 | 4,180 | 0.45 | 1,881 | 7.5% | 60.0% | 1.9% | 94.4% | B |
| 16 | 4,700 | 0.38 | 1,786 | 8.4% | 68.4% | 1.8% | 96.3% | C |
| 4 | 3,520 | 0.4 | 1,408 | 6.3% | 74.7% | 1.4% | 97.7% | C |
| 6 | 4,368 | 0.25 | 1,092 | 7.8% | 82.5% | 1.1% | 98.8% | C |
| 14 | 1,100 | 0.44 | 484 | 2.0% | 84.4% | 0.5% | 99.3% | C |
| 13 | 1,050 | 0.3 | 315 | 1.9% | 86.3% | 0.3% | 99.6% | C |
| 2 | 1,680 | 0.15 | 252 | 3.0% | 89.3% | 0.3% | 99.9% | C |
| 10 | 6,000 | 0.02 | 120 | 10.7% | 100.0% | 0.1% | 100.0% | C |
| TOTAL | 56,028 | 98,251 | 100.0% | 100.0% |

 Homework Sourse