Weinberg Theorem 273 lation Genetics I The Lab To Table 114
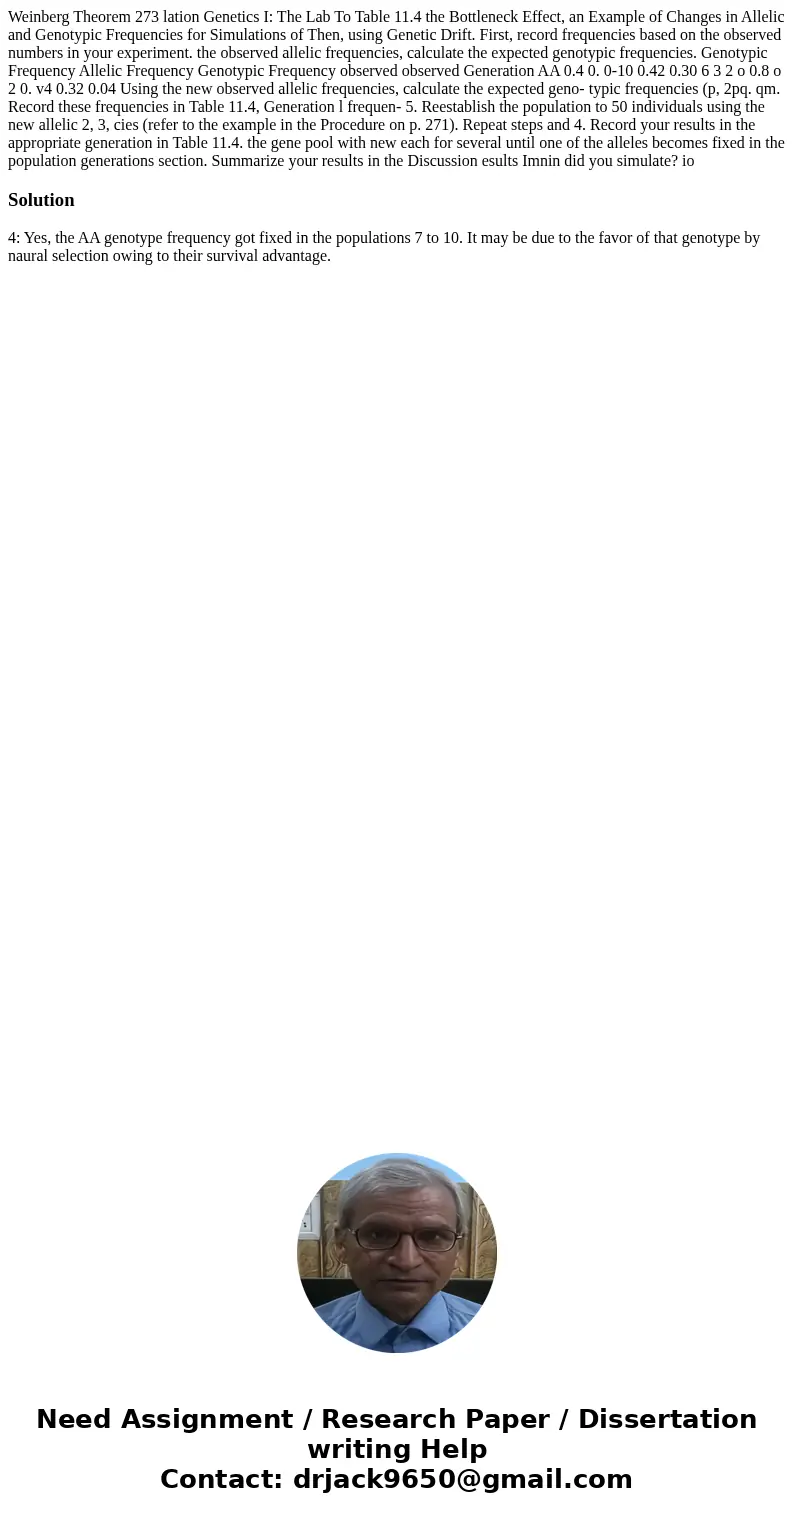
Weinberg Theorem 273 lation Genetics I: The Lab To Table 11.4 the Bottleneck Effect, an Example of Changes in Allelic and Genotypic Frequencies for Simulations of Then, using Genetic Drift. First, record frequencies based on the observed numbers in your experiment. the observed allelic frequencies, calculate the expected genotypic frequencies. Genotypic Frequency Allelic Frequency Genotypic Frequency observed observed Generation AA 0.4 0. 0-10 0.42 0.30 6 3 2 o 0.8 o 2 0. v4 0.32 0.04 Using the new observed allelic frequencies, calculate the expected geno- typic frequencies (p, 2pq. qm. Record these frequencies in Table 11.4, Generation l frequen- 5. Reestablish the population to 50 individuals using the new allelic 2, 3, cies (refer to the example in the Procedure on p. 271). Repeat steps and 4. Record your results in the appropriate generation in Table 11.4. the gene pool with new each for several until one of the alleles becomes fixed in the population generations section. Summarize your results in the Discussion esults Imnin did you simulate? io 
Solution
4: Yes, the AA genotype frequency got fixed in the populations 7 to 10. It may be due to the favor of that genotype by naural selection owing to their survival advantage.

 Homework Sourse