The following tables relates degree of interest in political
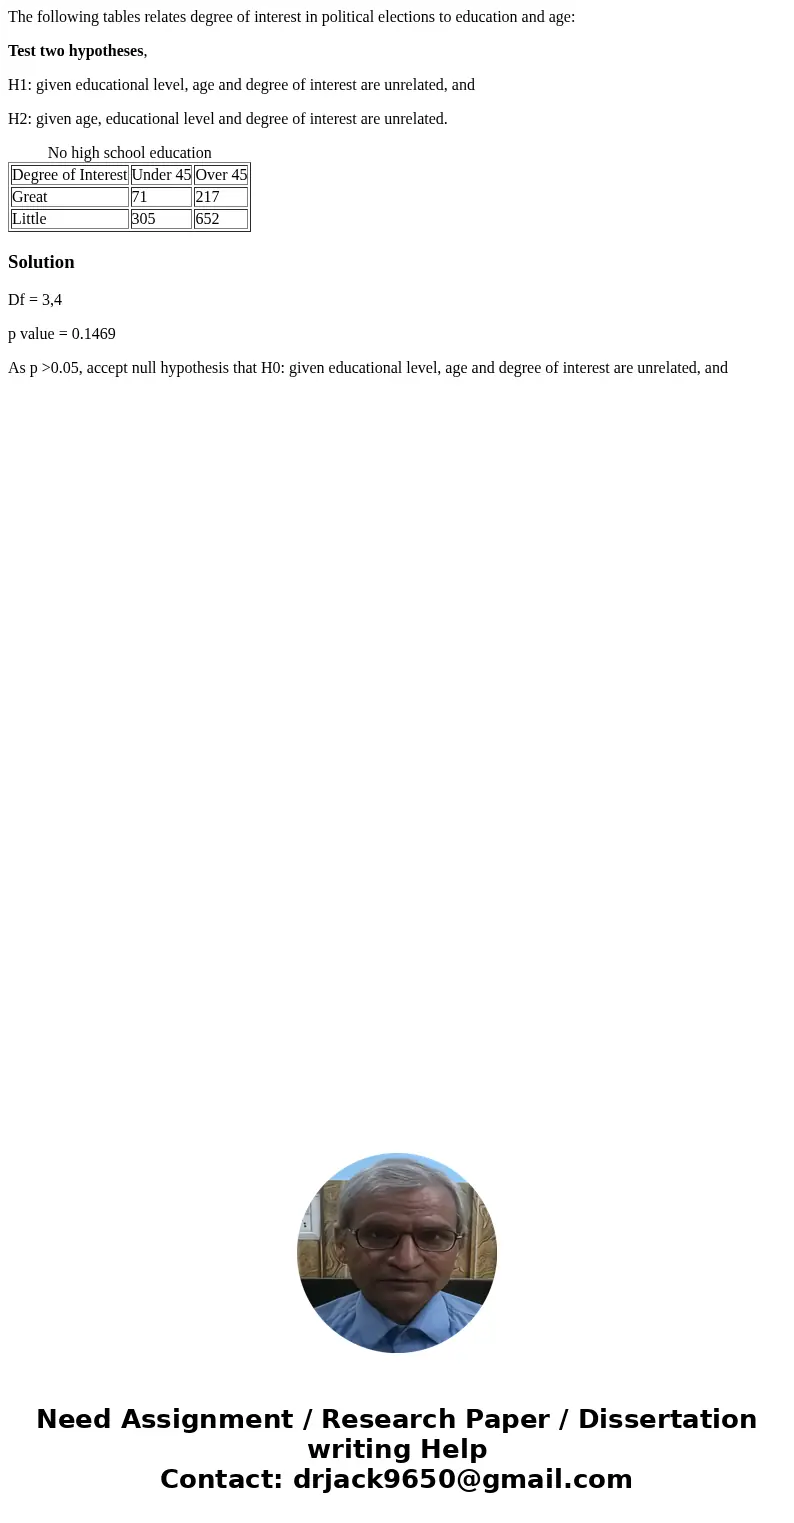
The following tables relates degree of interest in political elections to education and age:
Test two hypotheses,
H1: given educational level, age and degree of interest are unrelated, and
H2: given age, educational level and degree of interest are unrelated.
| Degree of Interest | Under 45 | Over 45 |
| Great | 71 | 217 |
| Little | 305 | 652 |
Solution
Df = 3,4
p value = 0.1469
As p >0.05, accept null hypothesis that H0: given educational level, age and degree of interest are unrelated, and

 Homework Sourse