HPL, Inc. Free Cash Flows 2011 2008 2009 2010 2012 2013 2014 2015 2016 2017 2018 Sales 84960 93881 103124 112700 122618 132887 143518 146389 149316 152303 Expenses: Raw Materials Expense Labor Cost Manufacturing Overhead Administrative Expense Maintenance Expense 45,12049,36953.698 58,109 62,60367,181 71,844 72,562 73,28874,021 18.640.0 20,233.3 22,842.4 25,254.6 27,807.6 30,508.4 33,364.2 34,532.0 35,740.6 36,991.5 5.115 6,627 7,323 8,044 8,791 9,564 10,365 11,19411,41811,647 11.880 2,936 76,556.9 83,280.8 91,130.1 98,896.2 106,918.6 115,206.2 123,770.3 126,100.4 128,491.0 130,942.8 4000 4,403.1 6,600.2 7,993.9 9,803.8 11,699.4 13,680.8 15,747.716,288.616,825.0 17,360.2 6515.4 6730.0 6944.1 2,641.93,960.14,796.35,882.37,019.78,208.59,448.6 9,773.1 10,095.0 10,416.1 4000 4,544 4.681 4,821 4.966 3,920 4,038 4,159 4,283 4,412 2,2502,318 2,387 2,459 2,532 4000 2,608 2,687 2,767 2.850 (Total Expenses) (Depreciation) EBIT 4000 4000 4000 4000 4000 4000 4000 4000 axes 1761.2 2640.1 3197.5 3921.5 4679.8 5472.3 6299.1 NOPAT 4000 4000 4000 4000 4000 4000 4000 4000 4000 (Capital Expenditures) 45000 Working Capital: Accounts Receivable Inventory (Accounts Payable) 11,223 12,40 13,622 14,887 16,197 17,554 18,95819,337 19,724 20,119 8,8659,796 10,760 11,759 12,794 13.86514,975 15,274 15,58015,891 14,470 12,016 13,277 14,585 15,939 17,342 18,794 20,298 20,704 21,118 21,540 422 8.072 8,919 9,798 10,707 11.650 12.625 13,635 13,908 14,186 Working Capital Net Working Capital Free Cash Flow 12,016 ,2621.307 1,3541,403 1,452 1,504 406 414 -45000.0 -5373.9 6698.4 7489.0 8528.0 9617.0 10756.1 11945.1 13367.2 13680.9 13993.8 Net Present Value IRR S4,063.995 11%
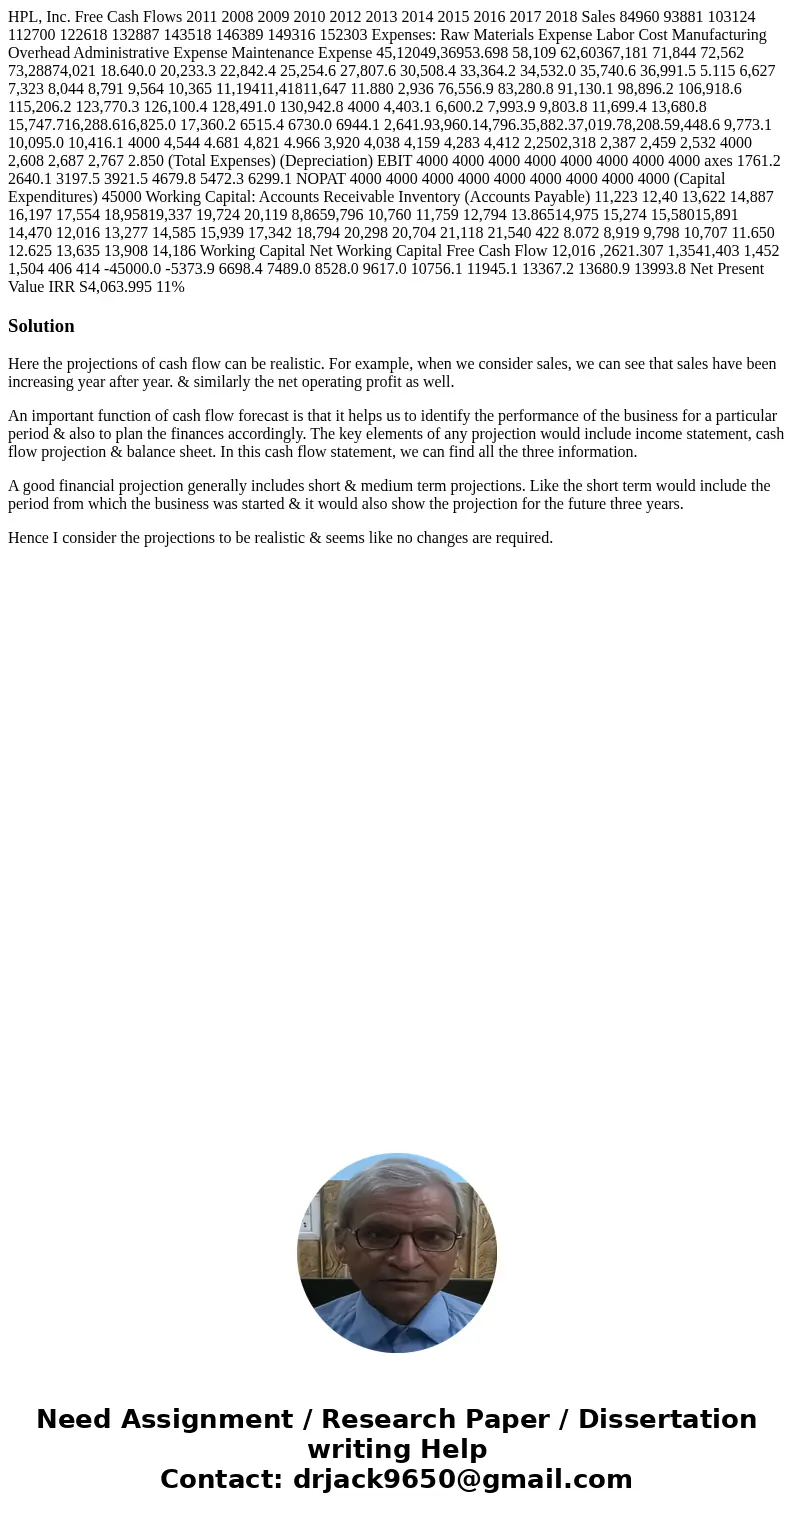
Here the projections of cash flow can be realistic. For example, when we consider sales, we can see that sales have been increasing year after year. & similarly the net operating profit as well.
An important function of cash flow forecast is that it helps us to identify the performance of the business for a particular period & also to plan the finances accordingly. The key elements of any projection would include income statement, cash flow projection & balance sheet. In this cash flow statement, we can find all the three information.
A good financial projection generally includes short & medium term projections. Like the short term would include the period from which the business was started & it would also show the projection for the future three years.
Hence I consider the projections to be realistic & seems like no changes are required.

 Homework Sourse