In this problem you are going to analyze the builtin R data
Solution
x=iris$Sepal.Width[iris$Species==\"virginica\"]
mean(x)
data.frame(x)
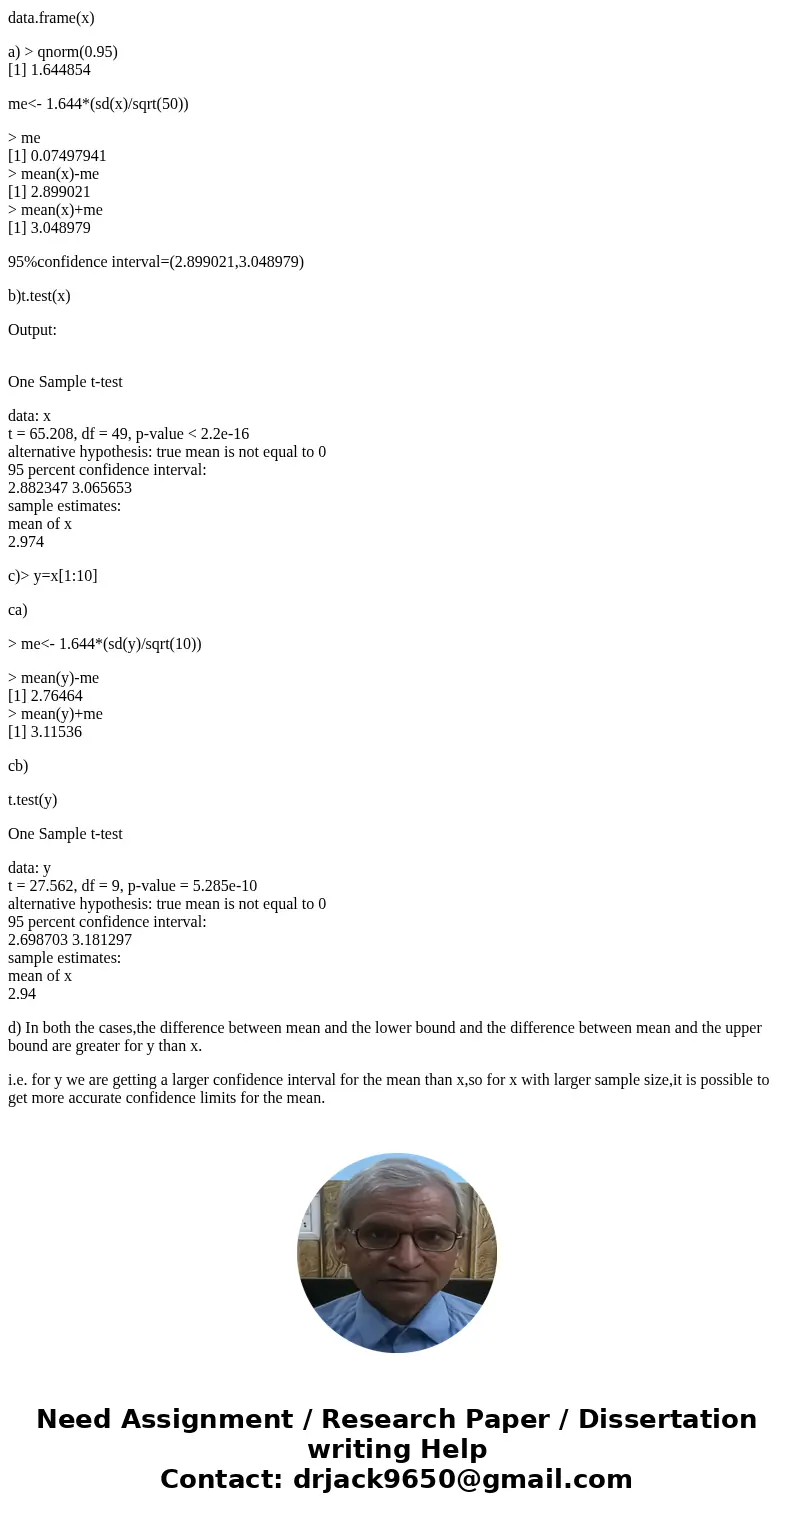
a) > qnorm(0.95)
[1] 1.644854
me<- 1.644*(sd(x)/sqrt(50))
> me
[1] 0.07497941
> mean(x)-me
[1] 2.899021
> mean(x)+me
[1] 3.048979
95%confidence interval=(2.899021,3.048979)
b)t.test(x)
Output:
One Sample t-test
data: x
t = 65.208, df = 49, p-value < 2.2e-16
alternative hypothesis: true mean is not equal to 0
95 percent confidence interval:
2.882347 3.065653
sample estimates:
mean of x
2.974
c)> y=x[1:10]
ca)
> me<- 1.644*(sd(y)/sqrt(10))
> mean(y)-me
[1] 2.76464
> mean(y)+me
[1] 3.11536
cb)
t.test(y)
One Sample t-test
data: y
t = 27.562, df = 9, p-value = 5.285e-10
alternative hypothesis: true mean is not equal to 0
95 percent confidence interval:
2.698703 3.181297
sample estimates:
mean of x
2.94
d) In both the cases,the difference between mean and the lower bound and the difference between mean and the upper bound are greater for y than x.
i.e. for y we are getting a larger confidence interval for the mean than x,so for x with larger sample size,it is possible to get more accurate confidence limits for the mean.


 Homework Sourse