The following table contains the first exam score and the se
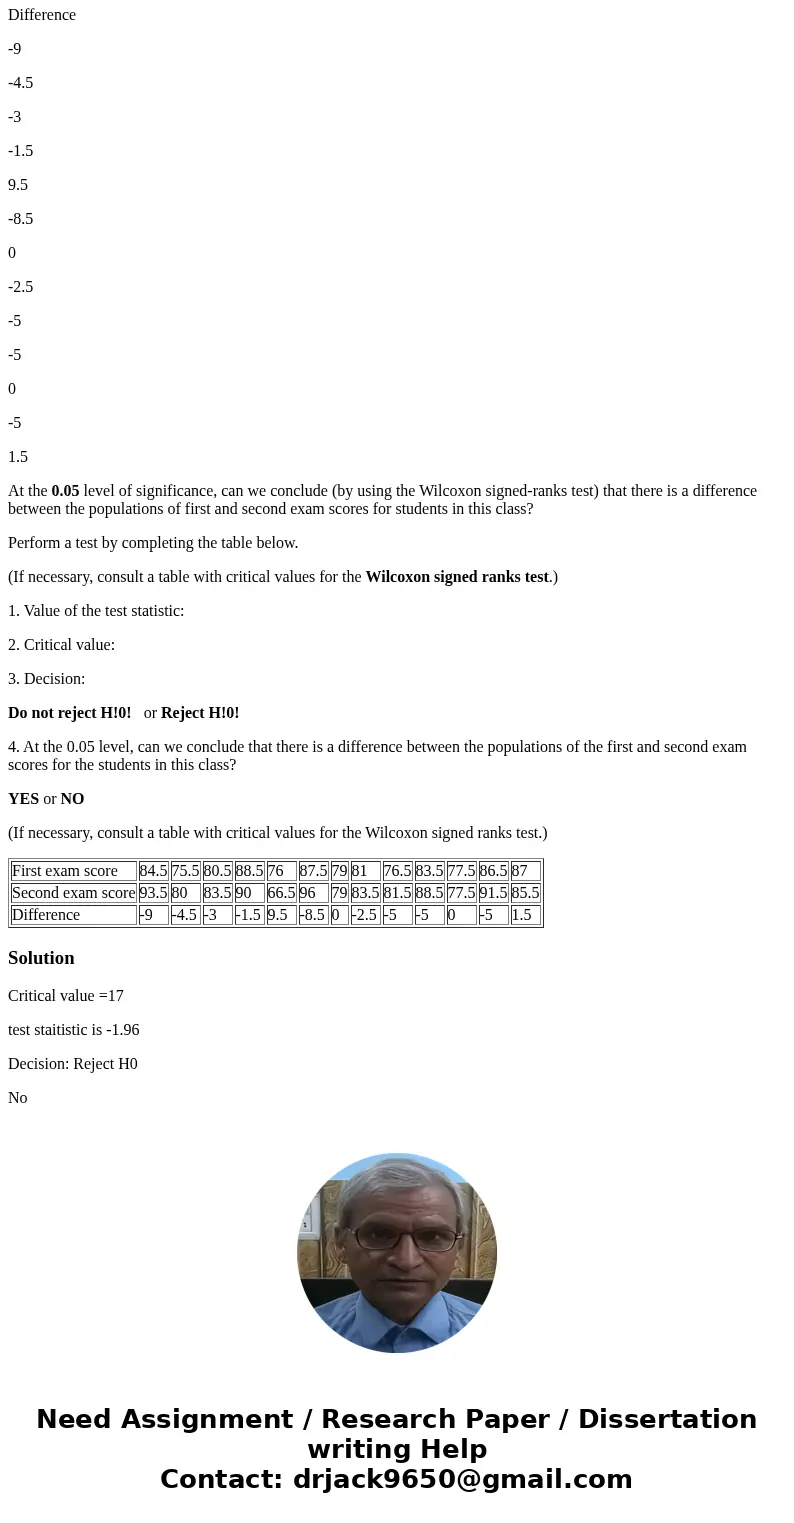
The following table contains the first exam score and the second exam score for a random sample of 13 students in a large college class.
First exam score
84.5
75.5
80.5
88.5
76
87.5
79
81
76.5
83.5
77.5
86.5
87
Second exam score
93.5
80
83.5
90
66.5
96
79
83.5
81.5
88.5
77.5
91.5
85.5
Difference
-9
-4.5
-3
-1.5
9.5
-8.5
0
-2.5
-5
-5
0
-5
1.5
At the 0.05 level of significance, can we conclude (by using the Wilcoxon signed-ranks test) that there is a difference between the populations of first and second exam scores for students in this class?
Perform a test by completing the table below.
(If necessary, consult a table with critical values for the Wilcoxon signed ranks test.)
1. Value of the test statistic:
2. Critical value:
3. Decision:
Do not reject H!0! or Reject H!0!
4. At the 0.05 level, can we conclude that there is a difference between the populations of the first and second exam scores for the students in this class?
YES or NO
(If necessary, consult a table with critical values for the Wilcoxon signed ranks test.)
| First exam score | 84.5 | 75.5 | 80.5 | 88.5 | 76 | 87.5 | 79 | 81 | 76.5 | 83.5 | 77.5 | 86.5 | 87 |
| Second exam score | 93.5 | 80 | 83.5 | 90 | 66.5 | 96 | 79 | 83.5 | 81.5 | 88.5 | 77.5 | 91.5 | 85.5 |
| Difference | -9 | -4.5 | -3 | -1.5 | 9.5 | -8.5 | 0 | -2.5 | -5 | -5 | 0 | -5 | 1.5 |
Solution
Critical value =17
test staitistic is -1.96
Decision: Reject H0
No


 Homework Sourse