Tree Diagrams 2 P Take a Test cynthia Davis Google Chrome ht
Tree Diagrams 2
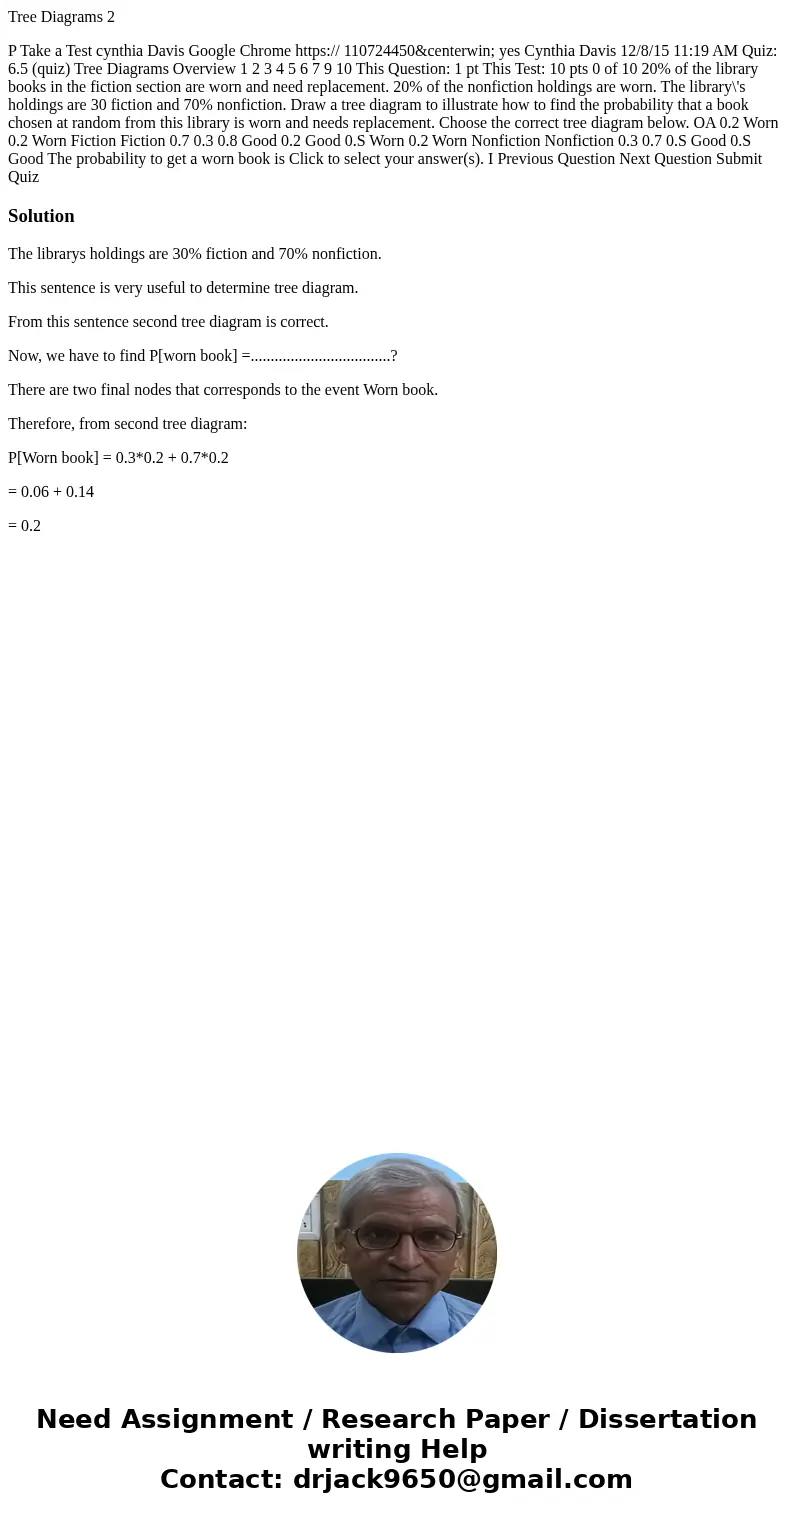
P Take a Test cynthia Davis Google Chrome https:// 110724450¢erwin; yes Cynthia Davis 12/8/15 11:19 AM Quiz: 6.5 (quiz) Tree Diagrams Overview 1 2 3 4 5 6 7 9 10 This Question: 1 pt This Test: 10 pts 0 of 10 20% of the library books in the fiction section are worn and need replacement. 20% of the nonfiction holdings are worn. The library\'s holdings are 30 fiction and 70% nonfiction. Draw a tree diagram to illustrate how to find the probability that a book chosen at random from this library is worn and needs replacement. Choose the correct tree diagram below. OA 0.2 Worn 0.2 Worn Fiction Fiction 0.7 0.3 0.8 Good 0.2 Good 0.S Worn 0.2 Worn Nonfiction Nonfiction 0.3 0.7 0.S Good 0.S Good The probability to get a worn book is Click to select your answer(s). I Previous Question Next Question Submit QuizSolution
The librarys holdings are 30% fiction and 70% nonfiction.
This sentence is very useful to determine tree diagram.
From this sentence second tree diagram is correct.
Now, we have to find P[worn book] =...................................?
There are two final nodes that corresponds to the event Worn book.
Therefore, from second tree diagram:
P[Worn book] = 0.3*0.2 + 0.7*0.2
= 0.06 + 0.14
= 0.2

 Homework Sourse