Montoure Company uses a perpetual inventory system It entere
Montoure Company uses a perpetual inventory system. It entered into the following calendar-year purchases and sales transactions. (For specific identification, units sold consist of 600 units from beginning inventory, 300 from the February 10 purchase, 200 from the March 13 purchase, 50 from the August 21 purchase, and 250 from the September 5 purchase.) Date Activities Units Acquired at Cost Units Sold at Retail Jan. 1 Beginning inventory 600 units @ $45.00 per unit Feb. 10 Purchase 400 units @ $42.00 per unit Mar. 13 Purchase 200 units @ $27.00 per unit Mar. 15 Sales 800 units @ $75.00 per unit Aug. 21 Purchase 100 units @ $50.00 per unit Sept. 5 Purchase 500 units @ $46.00 per unit Sept. 10 Sales 600 units @ $75.00 per unit Totals 1,800 units 1,400 units Required 1.Compute cost of goods available for sale and the number of units available for sale. 2.Compute the number of units in ending inventory. 3.Compute the cost assigned to ending inventory using (a) FIFO, (b) LIFO, (c) weighted average, and (d) specific identification. (Round all amounts to cents.) Check (3) Ending inventory: FIFO, $18,400; LIFO, $18,000; WA, $17,760 4.Compute gross profit earned by the company for each of the four costing methods in part 3. (4) LIFO gross profit, $45,800
Solution
Answer
Purchase
Units
Rate
Amount
Feb-10
400
42
16800
Mar-13
200
27
5400
Aug-21
100
50
5000
Sep-05
500
46
23000
Total
1200
50200
Sales
Units
Rate
Amount
Mar-15
800
75
60000
Sep-10
600
75
45000
0
Total
1400
105000
Cost of Goods Available for Sale = Opening Inventory + Purchases
= 27000 + 50200 = $77,200
Closing Inventory = Opening Inventory + Purchased units - Sold Units
= 600 + 1200 – 1400 = 400 units
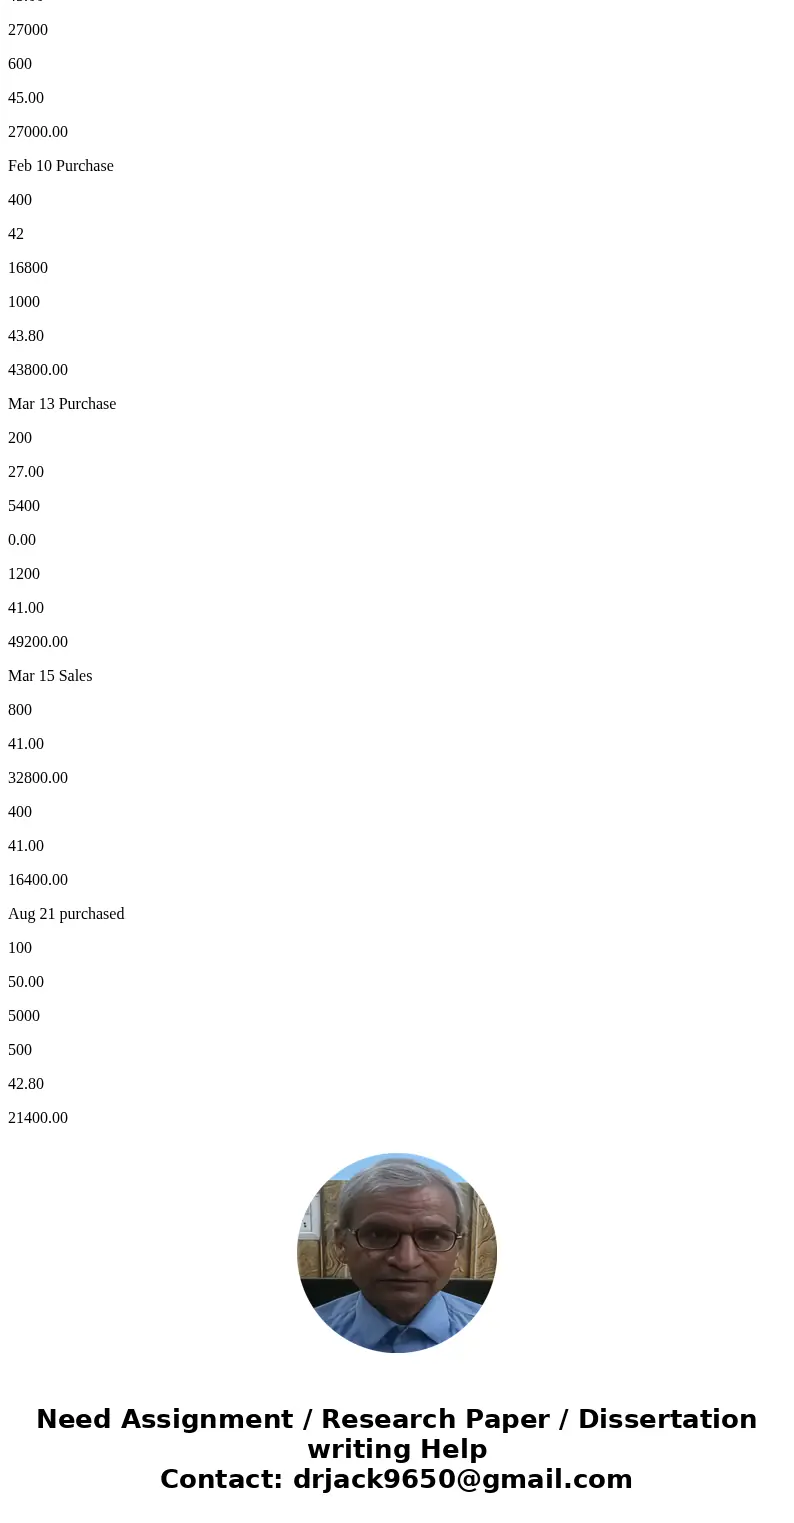
First, FIFO
FIFO
Opening + Purchases
Cost of Goods Sold
Closing Inventory
Opening Jan 1
600
45.00
27000
600
45.00
27000.00
Feb 10 Purchase
400
42.00
16800
600
45.00
27000.00
400
42.00
16800.00
Mar 13 Purchase
200
27.00
5400
600
45.00
27000.00
400
42.00
16800.00
200
27.00
5400.00
Mar 15 Sales
600
45.00
27000
200
42.00
8400.00
200
42.00
8400
200
27.00
5400.00
Aug 21 purchased
100
50.00
5000
200
42.00
8400.00
200
27.00
5400.00
100
50.00
5000.00
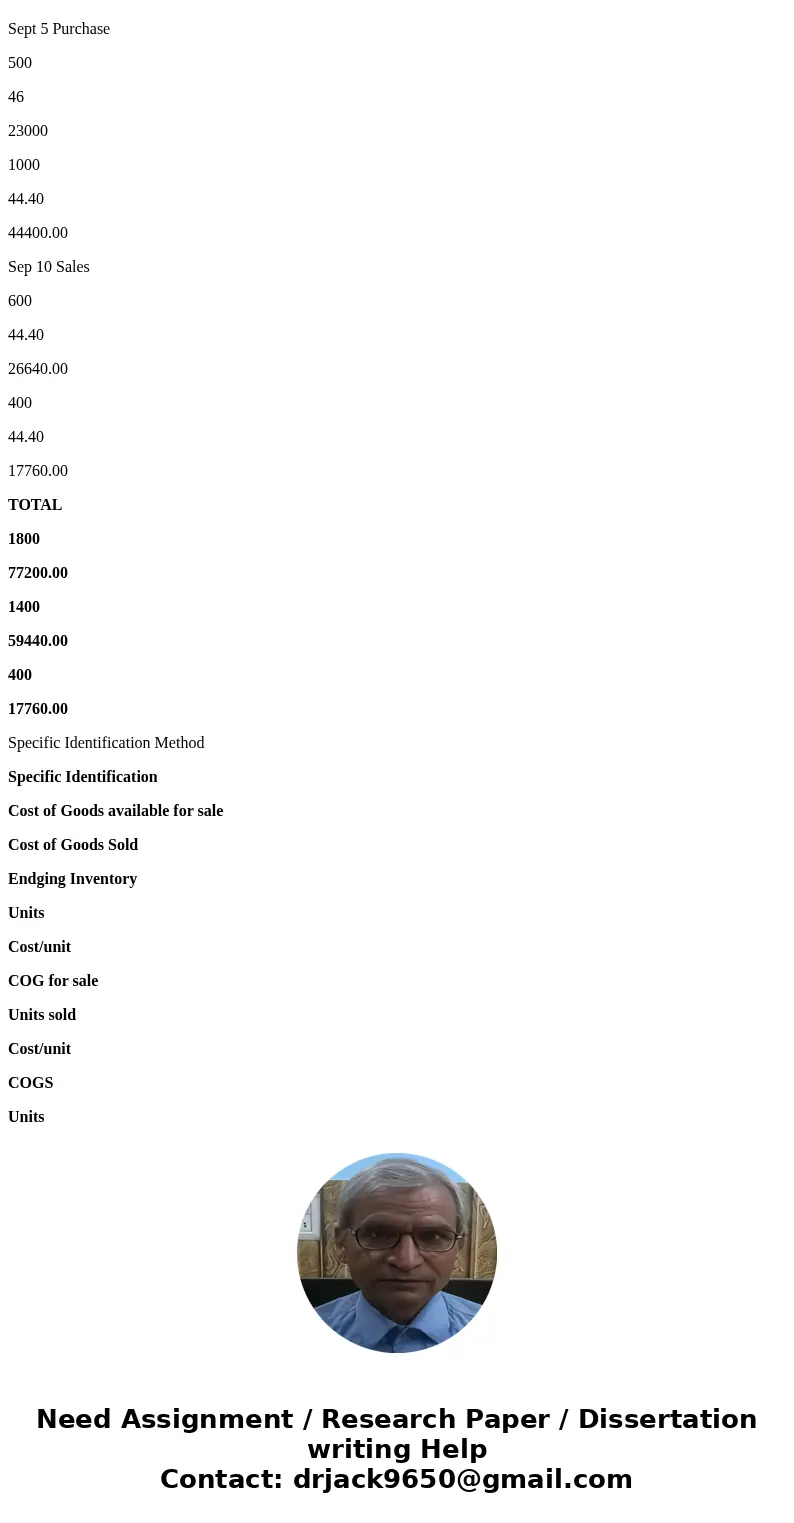
Sept 5 Purchase
500
46.00
23000
200
42.00
8400.00
200
27.00
5400.00
100
50.00
5000.00
500
46.00
23000.00
Sep 10 Sales
200
42.00
8400
400
46.00
18400.00
200
27.00
5400
100
50.00
5000
100
46.00
4600
TOTAL
1800
77200
1400
58800
400
18400.00
Units
Value
Cost of Goods Sold
1400
58800
Closing Inventory
400
18400
LIFO Method
LIFO
Opening + Purchases
Cost of Goods Sold
Closing Inventory
Opening Jan 1
600
45.00
27000
600
45.00
27000.00
Feb 10 Purchase
400
42.00
16800
600
45.00
27000.00
400
42.00
16800.00
Mar 13 Purchase
200
27.00
5400
600
45.00
27000.00
400
42.00
16800.00
200
27.00
5400.00
Mar 15 Sales
200
27.00
5400
400
45.00
18000.00
400
42.00
16800
0.00
200
45.00
9000
Aug 21 purchased
100
50.00
5000
400
45.00
18000.00
100
50.00
5000.00
0.00
Sept 5 Purchase
500
46.00
23000
400
45.00
18000.00
100
50.00
5000.00
500
46.00
23000.00
Sep 10 Sales
500
46.00
23000
400
45.00
18000.00
100
50.00
5000
TOTAL
1800
77200.00
1400
59200.00
400
18000.00
Units
Value
Cost of Goods Sold
1400
59200
Closing Inventory
400
18000
Weighted Average
Moving Average cost
Opening + Purchases
Cost of Goods Sold
Closing Inventory
Opening Jan 1
600
45.00
27000
600
45.00
27000.00
Feb 10 Purchase
400
42
16800
1000
43.80
43800.00
Mar 13 Purchase
200
27.00
5400
0.00
1200
41.00
49200.00
Mar 15 Sales
800
41.00
32800.00
400
41.00
16400.00
Aug 21 purchased
100
50.00
5000
500
42.80
21400.00
Sept 5 Purchase
500
46
23000
1000
44.40
44400.00
Sep 10 Sales
600
44.40
26640.00
400
44.40
17760.00
TOTAL
1800
77200.00
1400
59440.00
400
17760.00
Specific Identification Method
Specific Identification
Cost of Goods available for sale
Cost of Goods Sold
Endging Inventory
Units
Cost/unit
COG for sale
Units sold
Cost/unit
COGS
Units
Cost/unit
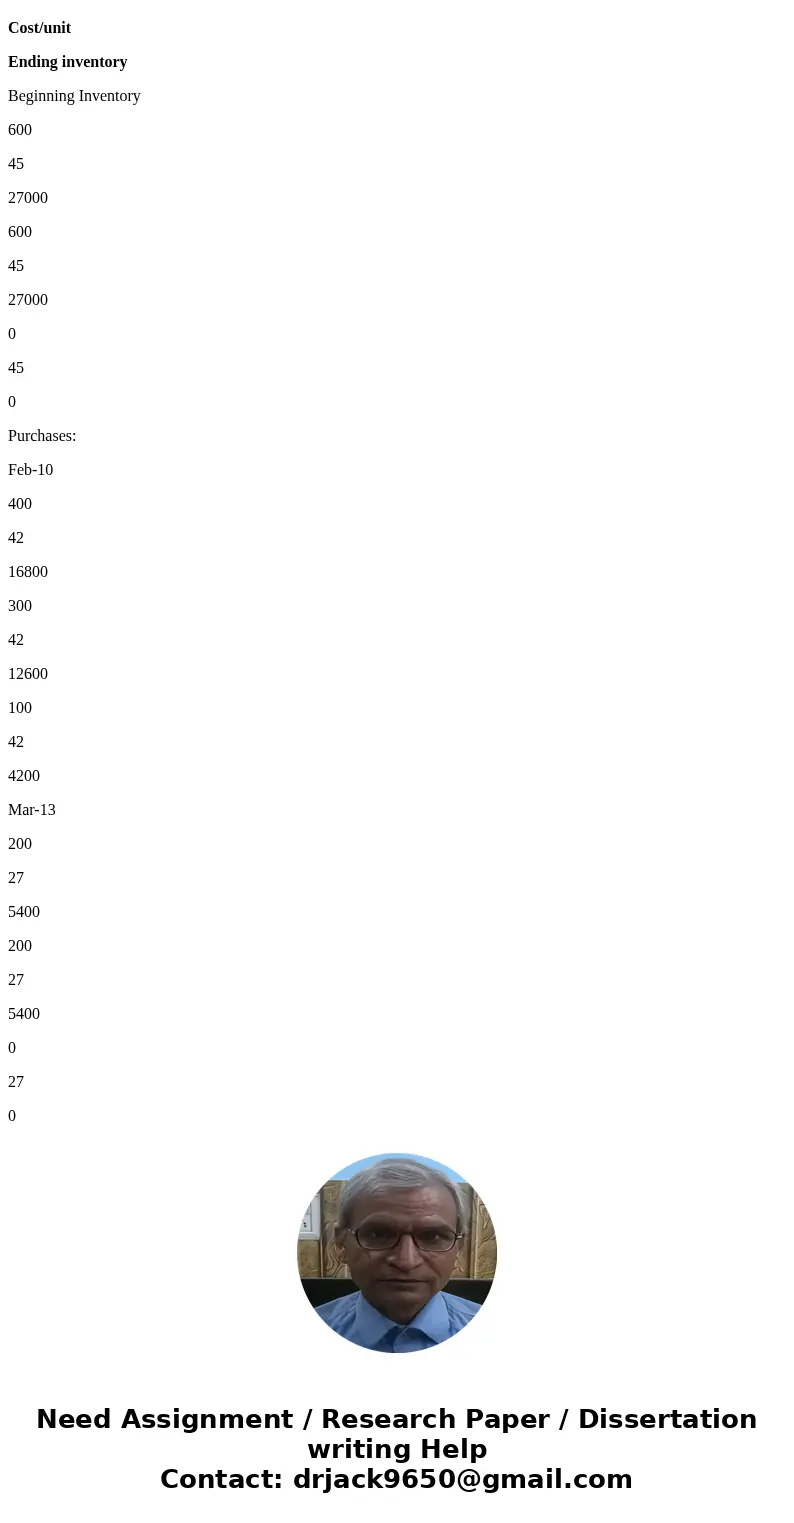
Ending inventory
Beginning Inventory
600
45
27000
600
45
27000
0
45
0
Purchases:
Feb-10
400
42
16800
300
42
12600
100
42
4200
Mar-13
200
27
5400
200
27
5400
0
27
0
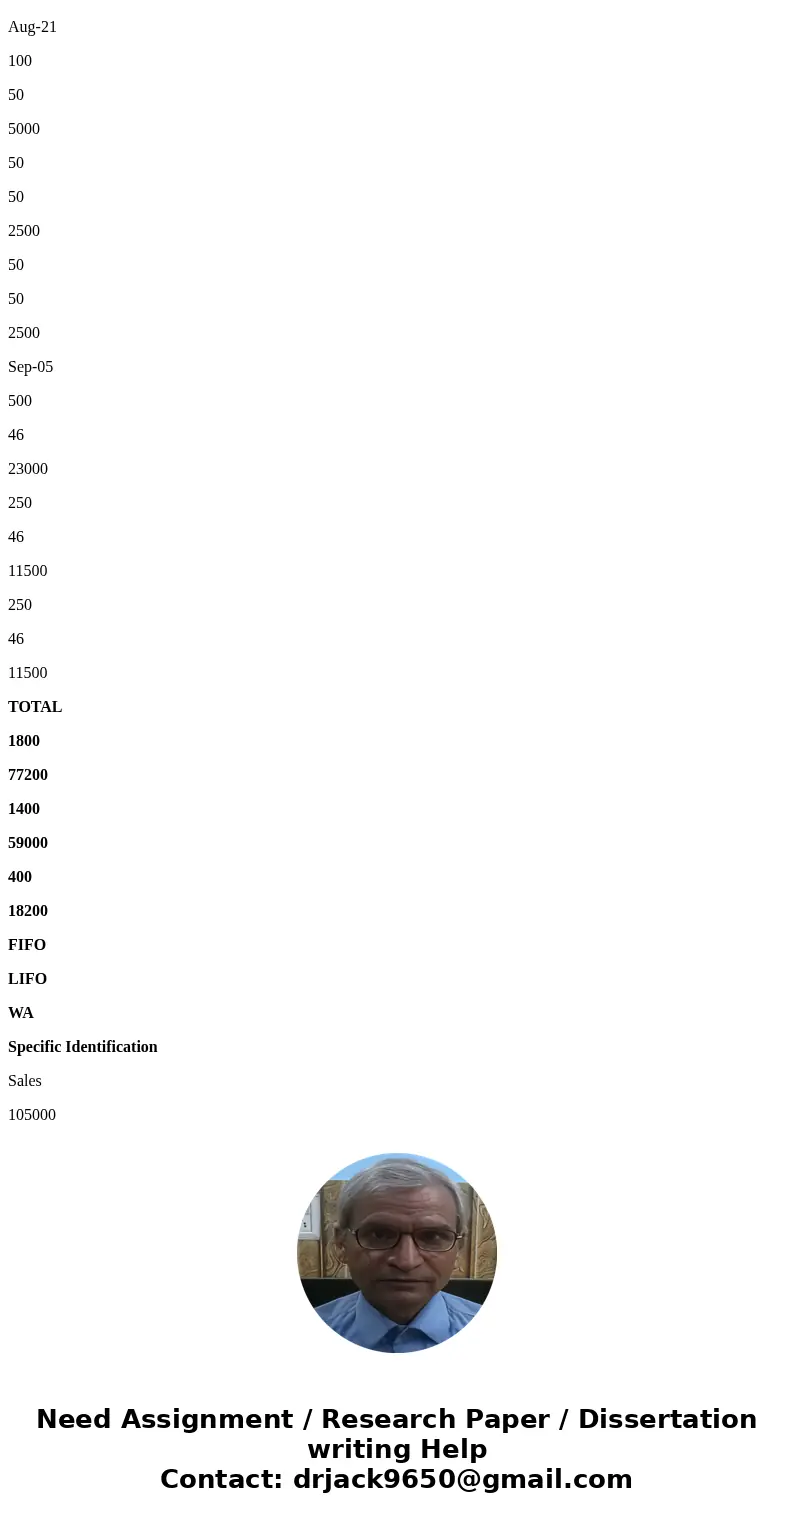
Aug-21
100
50
5000
50
50
2500
50
50
2500
Sep-05
500
46
23000
250
46
11500
250
46
11500
TOTAL
1800
77200
1400
59000
400
18200
FIFO
LIFO
WA
Specific Identification
Sales
105000
105000
105000
105000
Cost of Goods Sold as calculated above
58800
59200
59440
59000
Gross Profit
46200
45800
45560
46000
| Purchase | Units | Rate | Amount |
| Feb-10 | 400 | 42 | 16800 |
| Mar-13 | 200 | 27 | 5400 |
| Aug-21 | 100 | 50 | 5000 |
| Sep-05 | 500 | 46 | 23000 |
| Total | 1200 | 50200 |
 Homework Sourse