Question 2 Under Conclusion write if you think based on your
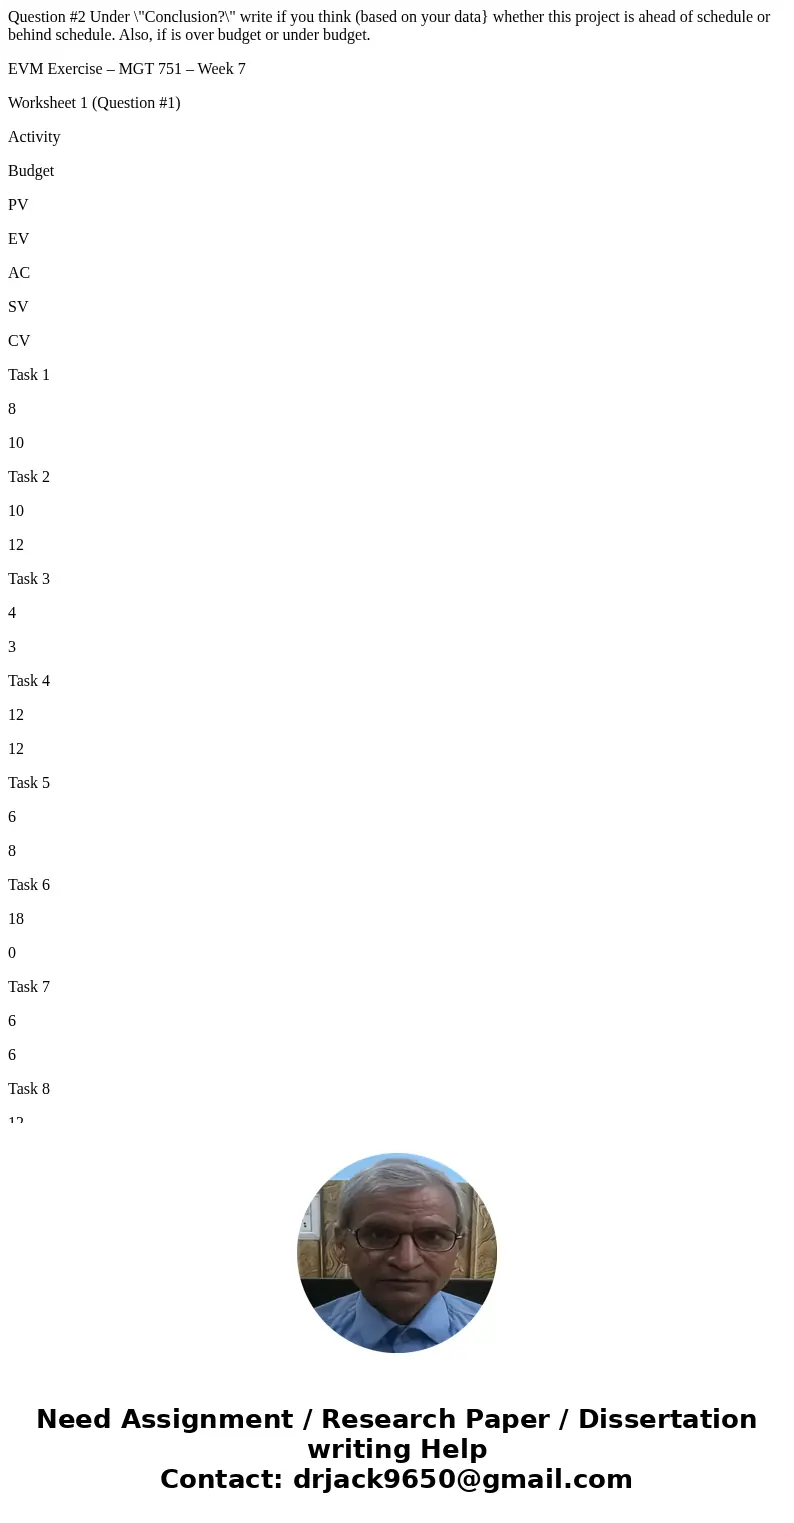
Question #2 Under \"Conclusion?\" write if you think (based on your data} whether this project is ahead of schedule or behind schedule. Also, if is over budget or under budget.
EVM Exercise – MGT 751 – Week 7
Worksheet 1 (Question #1)
Activity
Budget
PV
EV
AC
SV
CV
Task 1
8
10
Task 2
10
12
Task 3
4
3
Task 4
12
12
Task 5
6
8
Task 6
18
0
Task 7
6
6
Task 8
12
2
Task 9
10
0
Task 10
6
3
Task 11
8
0
Task 12
10
0
Task 13
12
12
Task 14
12
0
Task 15
8
0
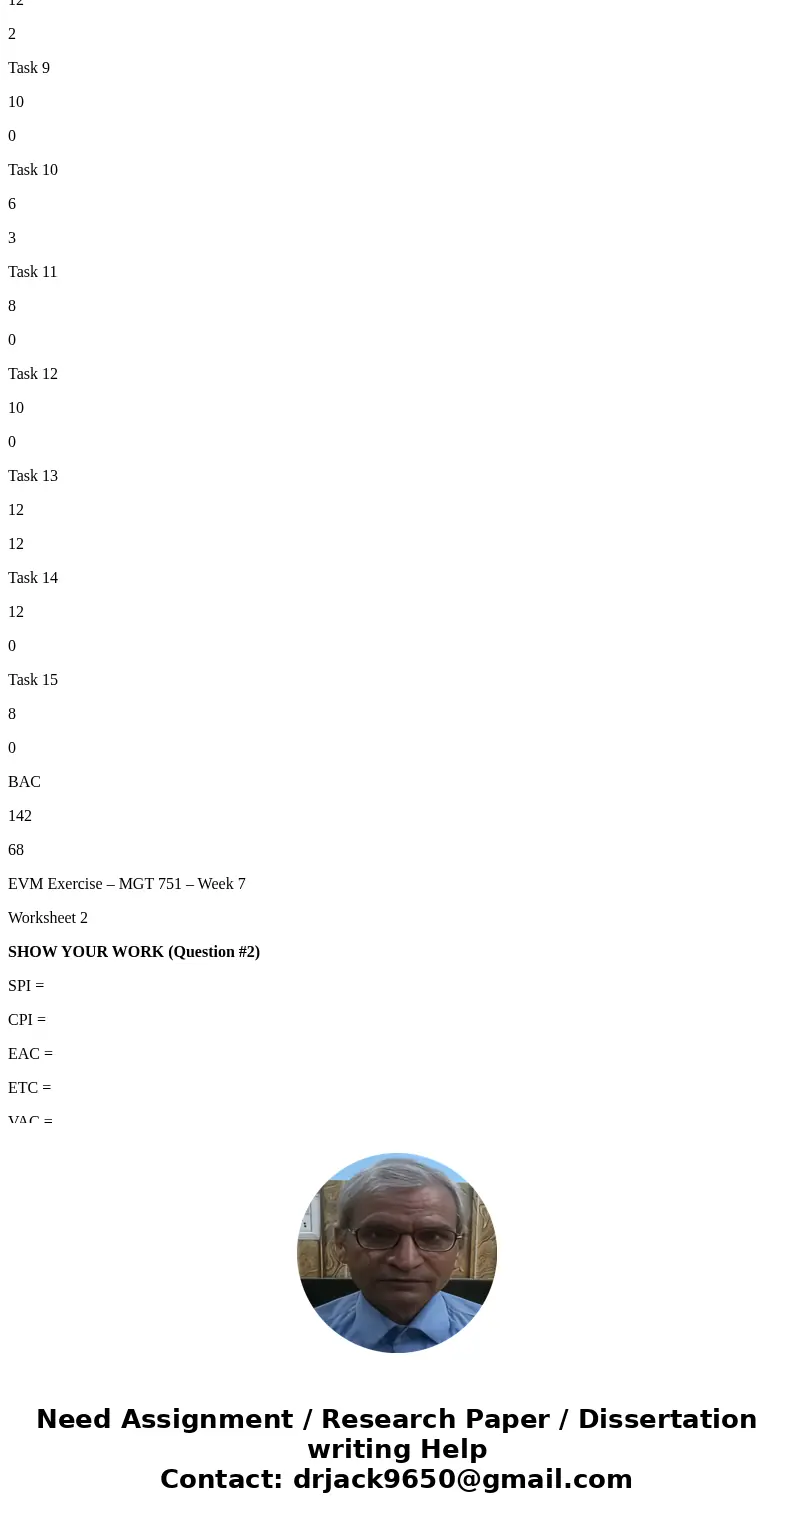
BAC
142
68
EVM Exercise – MGT 751 – Week 7
Worksheet 2
SHOW YOUR WORK (Question #2)
SPI =
CPI =
EAC =
ETC =
VAC =
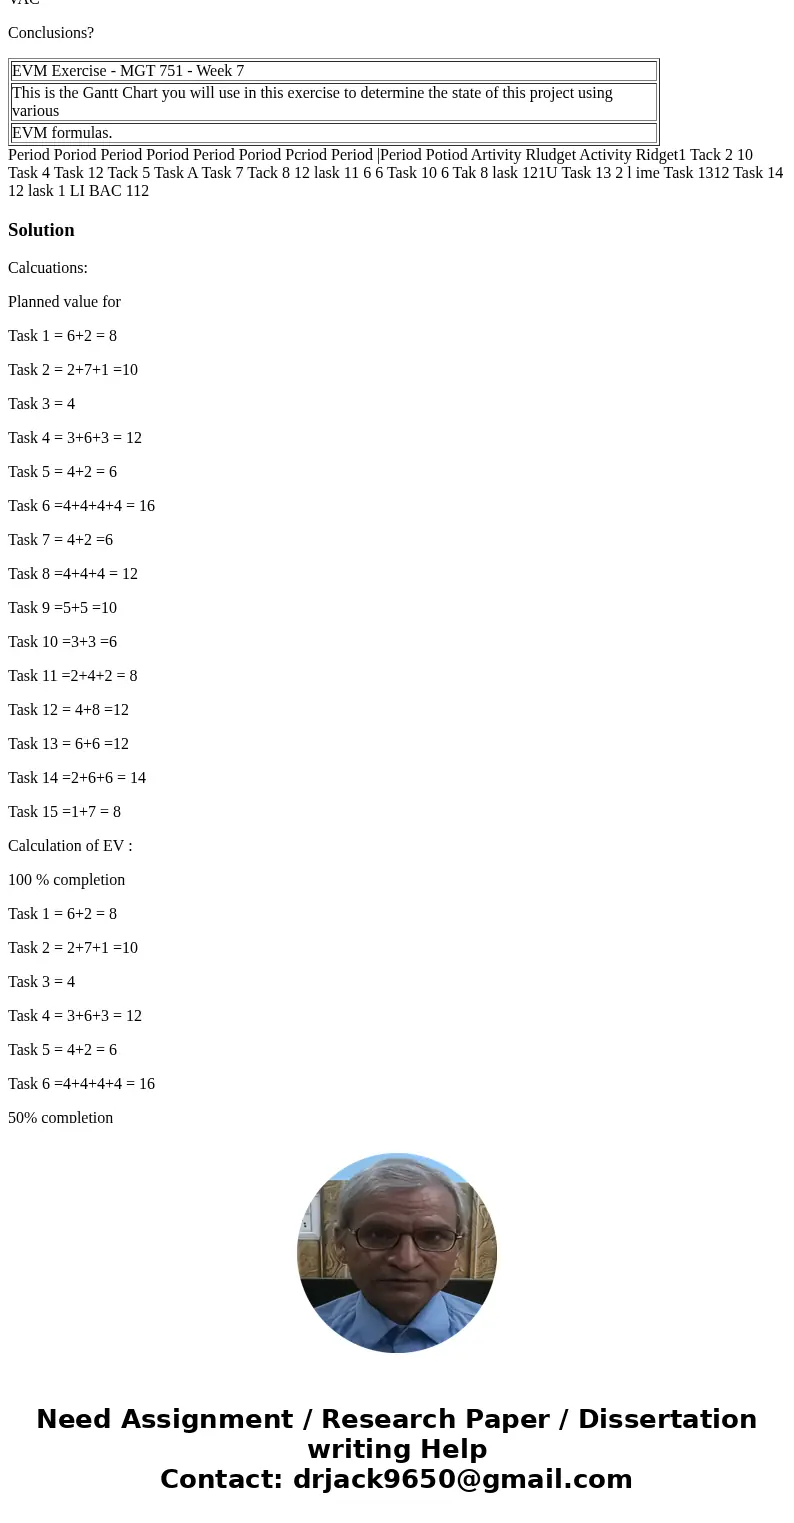
Conclusions?
| EVM Exercise - MGT 751 - Week 7 |
| This is the Gantt Chart you will use in this exercise to determine the state of this project using various |
| EVM formulas. |
Solution
Calcuations:
Planned value for
Task 1 = 6+2 = 8
Task 2 = 2+7+1 =10
Task 3 = 4
Task 4 = 3+6+3 = 12
Task 5 = 4+2 = 6
Task 6 =4+4+4+4 = 16
Task 7 = 4+2 =6
Task 8 =4+4+4 = 12
Task 9 =5+5 =10
Task 10 =3+3 =6
Task 11 =2+4+2 = 8
Task 12 = 4+8 =12
Task 13 = 6+6 =12
Task 14 =2+6+6 = 14
Task 15 =1+7 = 8
Calculation of EV :
100 % completion
Task 1 = 6+2 = 8
Task 2 = 2+7+1 =10
Task 3 = 4
Task 4 = 3+6+3 = 12
Task 5 = 4+2 = 6
Task 6 =4+4+4+4 = 16
50% completion
Task 7 = 4+2 =6 = 3
0 % completion
Task 8 =0
Task 9 =0
Task 10 =0
Task 11 =0
Task 12 =0
Task 13 =0
Task 14 =0
Task 15 =0
Quetion 2
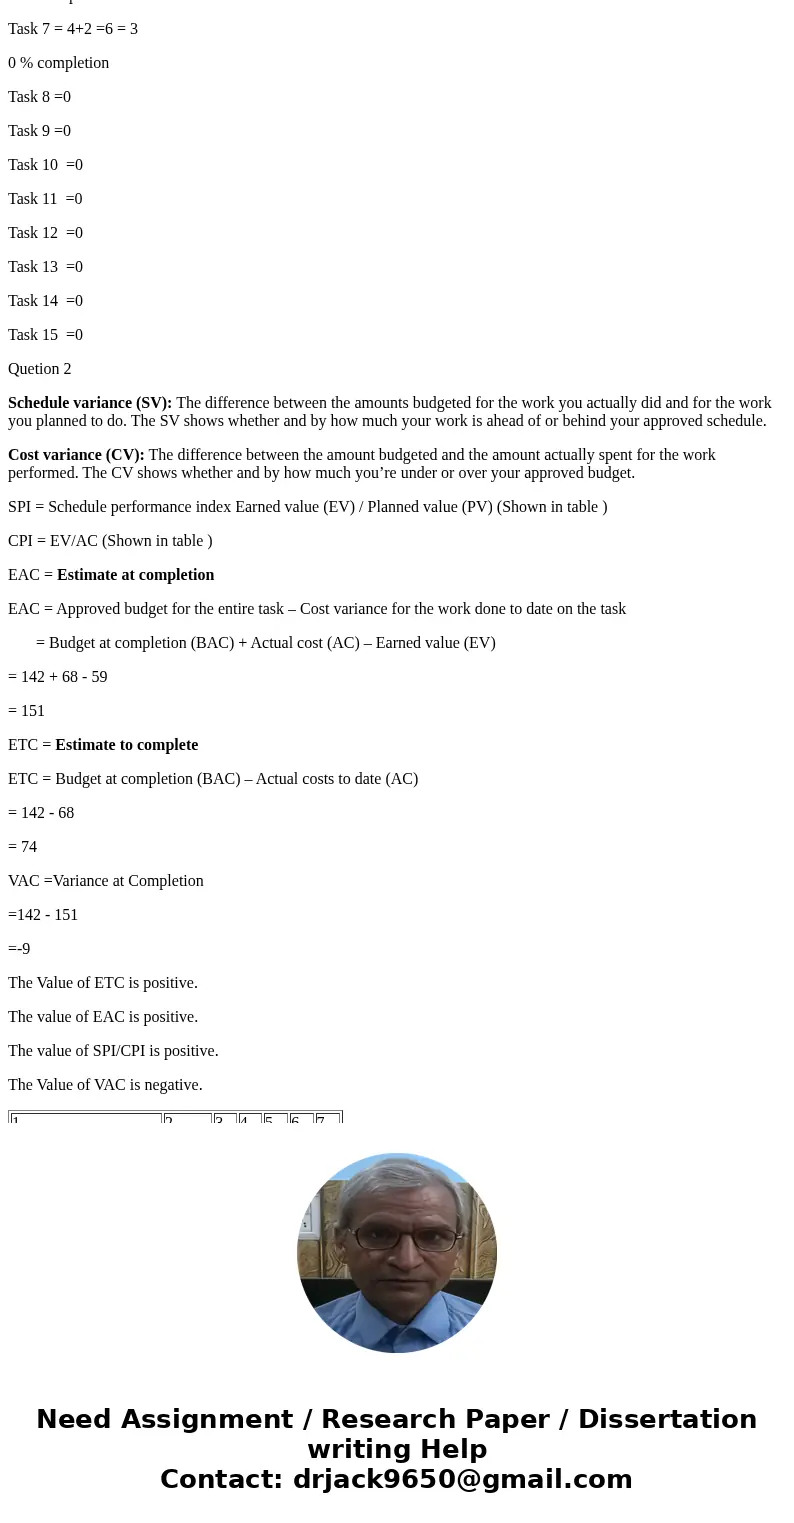
Schedule variance (SV): The difference between the amounts budgeted for the work you actually did and for the work you planned to do. The SV shows whether and by how much your work is ahead of or behind your approved schedule.
Cost variance (CV): The difference between the amount budgeted and the amount actually spent for the work performed. The CV shows whether and by how much you’re under or over your approved budget.
SPI = Schedule performance index Earned value (EV) / Planned value (PV) (Shown in table )
CPI = EV/AC (Shown in table )
EAC = Estimate at completion
EAC = Approved budget for the entire task – Cost variance for the work done to date on the task
= Budget at completion (BAC) + Actual cost (AC) – Earned value (EV)
= 142 + 68 - 59
= 151
ETC = Estimate to complete
ETC = Budget at completion (BAC) – Actual costs to date (AC)
= 142 - 68
= 74
VAC =Variance at Completion
=142 - 151
=-9
The Value of ETC is positive.
The value of EAC is positive.
The value of SPI/CPI is positive.
The Value of VAC is negative.
| 1 | 2 | 3 | 4 | 5 | 6 | 7 |
| Activity | Budget | PV | EV | AC | SV | CV |
| 4-3 | 4-5 | |||||
| Task 1 | 8 | 8 | 8 | 10 | 0 | -2 |
| Task 2 | 10 | 10 | 10 | 12 | 0 | -2 |
| Task 3 | 4 | 4 | 4 | 3 | 0 | 1 |
| Task 4 | 12 | 12 | 12 | 12 | 0 | 0 |
| Task 5 | 6 | 6 | 6 | 8 | 0 | -2 |
| Task 6 | 18 | 16 | 16 | 0 | 0 | 16 |
| Task 7 | 6 | 6 | 3 | 6 | -3 | -3 |
| Task 8 | 12 | 12 | 0 | 2 | -12 | -2 |
| Task 9 | 10 | 10 | 0 | 0 | -10 | 0 |
| Task 10 | 6 | 6 | 0 | 3 | -6 | -3 |
| Task 11 | 8 | 8 | 0 | 0 | -8 | 0 |
| Task 12 | 10 | 12 | 0 | 0 | -12 | 0 |
| Task 13 | 12 | 12 | 0 | 12 | -12 | -12 |
| Task 14 | 12 | 14 | 0 | 0 | -14 | 0 |
| Task 15 | 8 | 8 | 0 | 0 | -8 | 0 |
| BAC | 142 | 68 |
 Homework Sourse