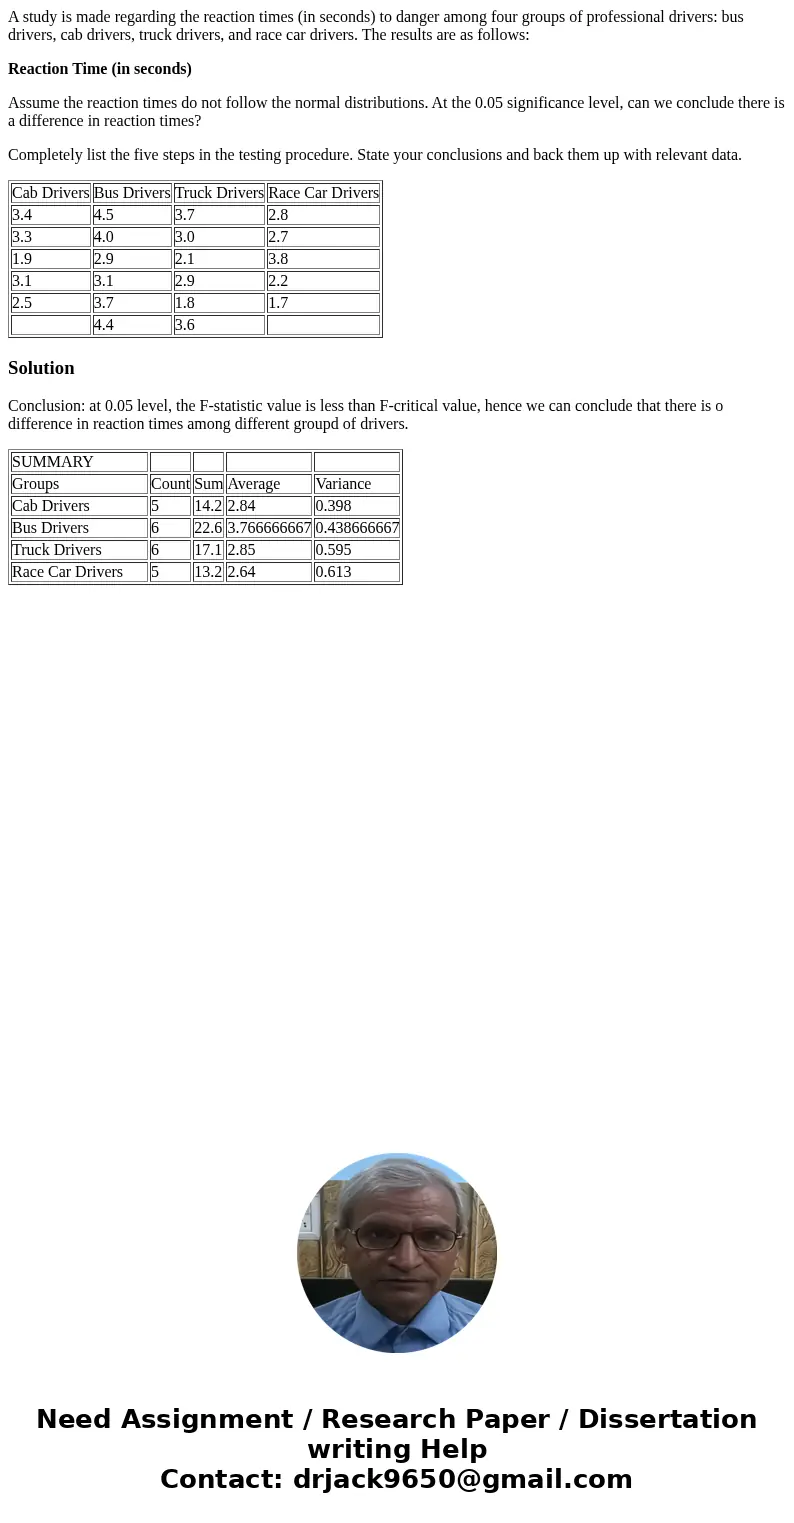
A study is made regarding the reaction times in seconds to d
A study is made regarding the reaction times (in seconds) to danger among four groups of professional drivers: bus drivers, cab drivers, truck drivers, and race car drivers. The results are as follows:
Reaction Time (in seconds)
Assume the reaction times do not follow the normal distributions. At the 0.05 significance level, can we conclude there is a difference in reaction times?
Completely list the five steps in the testing procedure. State your conclusions and back them up with relevant data.
| Cab Drivers | Bus Drivers | Truck Drivers | Race Car Drivers |
| 3.4 | 4.5 | 3.7 | 2.8 |
| 3.3 | 4.0 | 3.0 | 2.7 |
| 1.9 | 2.9 | 2.1 | 3.8 |
| 3.1 | 3.1 | 2.9 | 2.2 |
| 2.5 | 3.7 | 1.8 | 1.7 |
| 4.4 | 3.6 |
Solution
Conclusion: at 0.05 level, the F-statistic value is less than F-critical value, hence we can conclude that there is o difference in reaction times among different groupd of drivers.
| SUMMARY | ||||
| Groups | Count | Sum | Average | Variance |
| Cab Drivers | 5 | 14.2 | 2.84 | 0.398 |
| Bus Drivers | 6 | 22.6 | 3.766666667 | 0.438666667 |
| Truck Drivers | 6 | 17.1 | 2.85 | 0.595 |
| Race Car Drivers | 5 | 13.2 | 2.64 | 0.613 |

 Homework Sourse