Question 1 Management believes that a new dealership can sel
Question 1: Management believes that a new dealership can sell 12 new cars each week. What is the 90% confidence interval for expected total profit?
$49,072.61 to $53,662.37
$36,907.97 to $65,827.01
$45,812.31 to $52,127.96
$12,0148.35 to $58,147.38
Question 2: Management is admitting that number of new cars sold each week is the key to predicting total profit and asks you to confirm their belief. Which of the following statements would you use to answer management?
A. Yes, everyone knows the more new cars you sell the higher the profit
B. Yes, number of new cars sold each week is a good predictor of profit because the coefficient of determination is 0.66 and is the population coefficient of determination is statistically different from zero at the 0.05 level.
C. Yes, number of new cars sold each week is a good predictor of profit because the coefficient of determination is 0.81 and is the population coefficient of determination is statistically different from zero at the 0.05 level.
D. No, number of new cars sold each week is not a good predictor of profit because the coefficient of determination is 0.05 and it can’t be said that the population coefficient of determination is statistically different from zero at the 0.05 level.
Question 3:
Jill, an aggressive member of the management team, has suggested the company should close all their used-car lots. She proposes to simply sell every used car taken in on trade, to the wholesale market. You are asked to analyze the data and worthiness of this suggestion, and offer an opinion based on your analysis. Which of the following is the best response?
A. Jill is incorrect because every used car sold results in an additional profit of $3,298 with a correlation coefficient value of 0.81.
B. While Jill appears to be correct since a used-car sale results in an average loss of ~$1,684, you cannot say, at the 0.05 significance level, that the population slope is different than zero.
C. Jill appears to be correct since a used-car sale results in an average loss of ~$1,684, and the correlation coefficient value of 0.22 is considered good.
D. You suggest that analysis of only one week of data (which is contained in the Excel file) is not sufficient information to draw a solid conclusion.
E. Both B and D are correct.
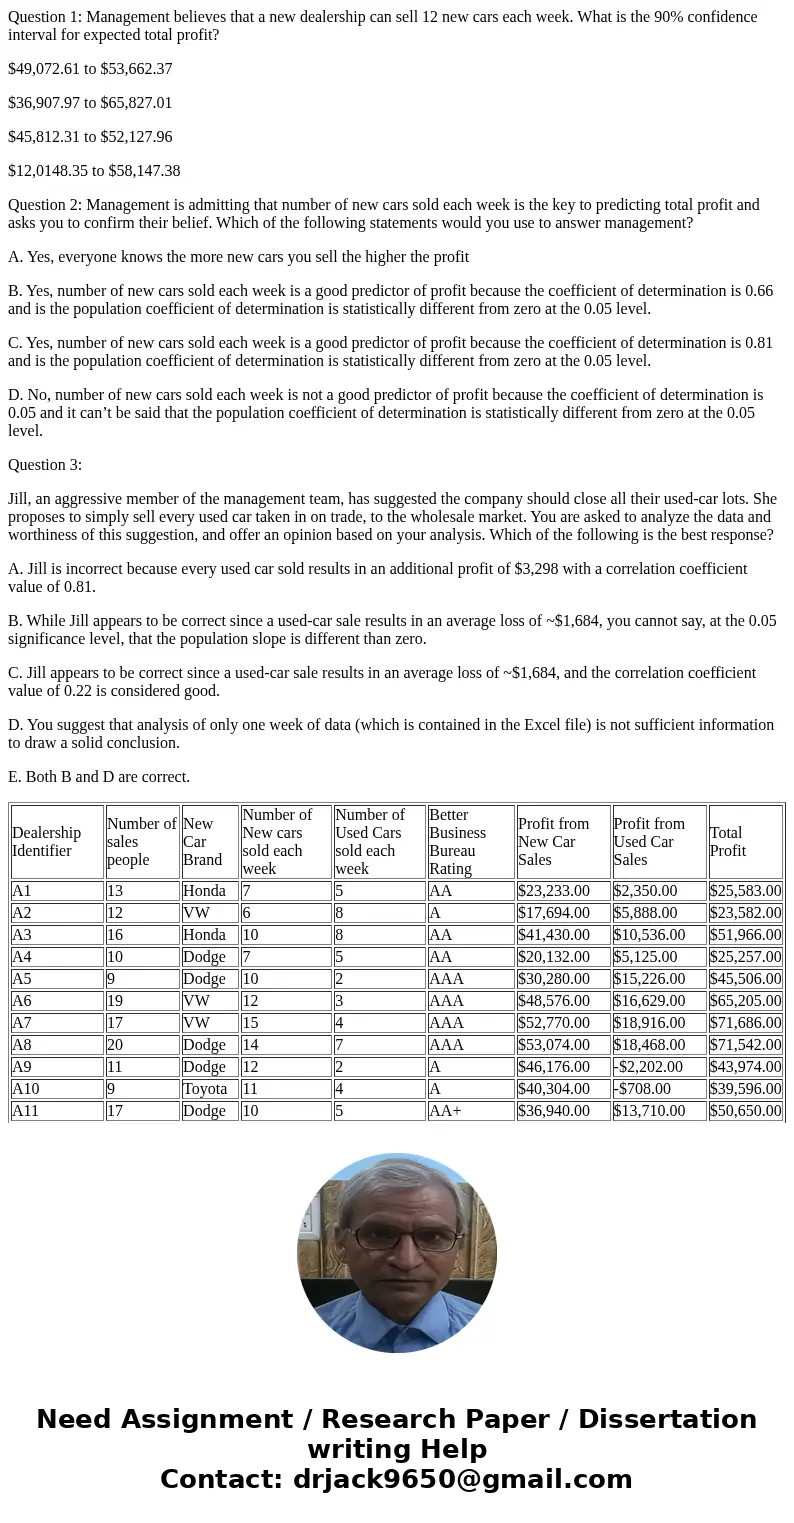
| Dealership Identifier | Number of sales people | New Car Brand | Number of New cars sold each week | Number of Used Cars sold each week | Better Business Bureau Rating | Profit from New Car Sales | Profit from Used Car Sales | Total Profit |
| A1 | 13 | Honda | 7 | 5 | AA | $23,233.00 | $2,350.00 | $25,583.00 |
| A2 | 12 | VW | 6 | 8 | A | $17,694.00 | $5,888.00 | $23,582.00 |
| A3 | 16 | Honda | 10 | 8 | AA | $41,430.00 | $10,536.00 | $51,966.00 |
| A4 | 10 | Dodge | 7 | 5 | AA | $20,132.00 | $5,125.00 | $25,257.00 |
| A5 | 9 | Dodge | 10 | 2 | AAA | $30,280.00 | $15,226.00 | $45,506.00 |
| A6 | 19 | VW | 12 | 3 | AAA | $48,576.00 | $16,629.00 | $65,205.00 |
| A7 | 17 | VW | 15 | 4 | AAA | $52,770.00 | $18,916.00 | $71,686.00 |
| A8 | 20 | Dodge | 14 | 7 | AAA | $53,074.00 | $18,468.00 | $71,542.00 |
| A9 | 11 | Dodge | 12 | 2 | A | $46,176.00 | -$2,202.00 | $43,974.00 |
| A10 | 9 | Toyota | 11 | 4 | A | $40,304.00 | -$708.00 | $39,596.00 |
| A11 | 17 | Dodge | 10 | 5 | AA+ | $36,940.00 | $13,710.00 | $50,650.00 |
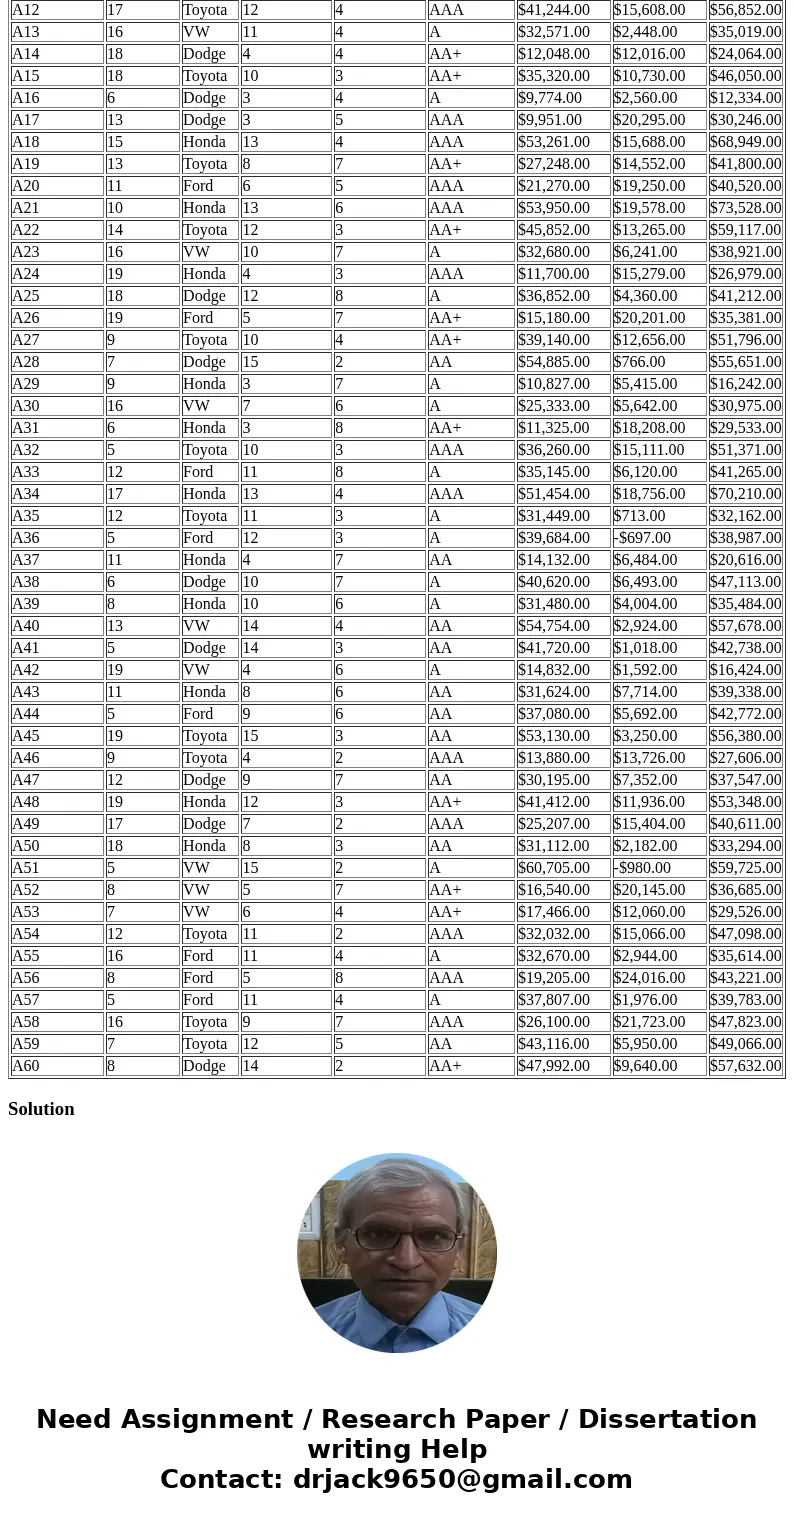
| A12 | 17 | Toyota | 12 | 4 | AAA | $41,244.00 | $15,608.00 | $56,852.00 |
| A13 | 16 | VW | 11 | 4 | A | $32,571.00 | $2,448.00 | $35,019.00 |
| A14 | 18 | Dodge | 4 | 4 | AA+ | $12,048.00 | $12,016.00 | $24,064.00 |
| A15 | 18 | Toyota | 10 | 3 | AA+ | $35,320.00 | $10,730.00 | $46,050.00 |
| A16 | 6 | Dodge | 3 | 4 | A | $9,774.00 | $2,560.00 | $12,334.00 |
| A17 | 13 | Dodge | 3 | 5 | AAA | $9,951.00 | $20,295.00 | $30,246.00 |
| A18 | 15 | Honda | 13 | 4 | AAA | $53,261.00 | $15,688.00 | $68,949.00 |
| A19 | 13 | Toyota | 8 | 7 | AA+ | $27,248.00 | $14,552.00 | $41,800.00 |
| A20 | 11 | Ford | 6 | 5 | AAA | $21,270.00 | $19,250.00 | $40,520.00 |
| A21 | 10 | Honda | 13 | 6 | AAA | $53,950.00 | $19,578.00 | $73,528.00 |
| A22 | 14 | Toyota | 12 | 3 | AA+ | $45,852.00 | $13,265.00 | $59,117.00 |
| A23 | 16 | VW | 10 | 7 | A | $32,680.00 | $6,241.00 | $38,921.00 |
| A24 | 19 | Honda | 4 | 3 | AAA | $11,700.00 | $15,279.00 | $26,979.00 |
| A25 | 18 | Dodge | 12 | 8 | A | $36,852.00 | $4,360.00 | $41,212.00 |
| A26 | 19 | Ford | 5 | 7 | AA+ | $15,180.00 | $20,201.00 | $35,381.00 |
| A27 | 9 | Toyota | 10 | 4 | AA+ | $39,140.00 | $12,656.00 | $51,796.00 |
| A28 | 7 | Dodge | 15 | 2 | AA | $54,885.00 | $766.00 | $55,651.00 |
| A29 | 9 | Honda | 3 | 7 | A | $10,827.00 | $5,415.00 | $16,242.00 |
| A30 | 16 | VW | 7 | 6 | A | $25,333.00 | $5,642.00 | $30,975.00 |
| A31 | 6 | Honda | 3 | 8 | AA+ | $11,325.00 | $18,208.00 | $29,533.00 |
| A32 | 5 | Toyota | 10 | 3 | AAA | $36,260.00 | $15,111.00 | $51,371.00 |
| A33 | 12 | Ford | 11 | 8 | A | $35,145.00 | $6,120.00 | $41,265.00 |
| A34 | 17 | Honda | 13 | 4 | AAA | $51,454.00 | $18,756.00 | $70,210.00 |
| A35 | 12 | Toyota | 11 | 3 | A | $31,449.00 | $713.00 | $32,162.00 |
| A36 | 5 | Ford | 12 | 3 | A | $39,684.00 | -$697.00 | $38,987.00 |
| A37 | 11 | Honda | 4 | 7 | AA | $14,132.00 | $6,484.00 | $20,616.00 |
| A38 | 6 | Dodge | 10 | 7 | A | $40,620.00 | $6,493.00 | $47,113.00 |
| A39 | 8 | Honda | 10 | 6 | A | $31,480.00 | $4,004.00 | $35,484.00 |
| A40 | 13 | VW | 14 | 4 | AA | $54,754.00 | $2,924.00 | $57,678.00 |
| A41 | 5 | Dodge | 14 | 3 | AA | $41,720.00 | $1,018.00 | $42,738.00 |
| A42 | 19 | VW | 4 | 6 | A | $14,832.00 | $1,592.00 | $16,424.00 |
| A43 | 11 | Honda | 8 | 6 | AA | $31,624.00 | $7,714.00 | $39,338.00 |
| A44 | 5 | Ford | 9 | 6 | AA | $37,080.00 | $5,692.00 | $42,772.00 |
| A45 | 19 | Toyota | 15 | 3 | AA | $53,130.00 | $3,250.00 | $56,380.00 |
| A46 | 9 | Toyota | 4 | 2 | AAA | $13,880.00 | $13,726.00 | $27,606.00 |
| A47 | 12 | Dodge | 9 | 7 | AA | $30,195.00 | $7,352.00 | $37,547.00 |
| A48 | 19 | Honda | 12 | 3 | AA+ | $41,412.00 | $11,936.00 | $53,348.00 |
| A49 | 17 | Dodge | 7 | 2 | AAA | $25,207.00 | $15,404.00 | $40,611.00 |
| A50 | 18 | Honda | 8 | 3 | AA | $31,112.00 | $2,182.00 | $33,294.00 |
| A51 | 5 | VW | 15 | 2 | A | $60,705.00 | -$980.00 | $59,725.00 |
| A52 | 8 | VW | 5 | 7 | AA+ | $16,540.00 | $20,145.00 | $36,685.00 |
| A53 | 7 | VW | 6 | 4 | AA+ | $17,466.00 | $12,060.00 | $29,526.00 |
| A54 | 12 | Toyota | 11 | 2 | AAA | $32,032.00 | $15,066.00 | $47,098.00 |
| A55 | 16 | Ford | 11 | 4 | A | $32,670.00 | $2,944.00 | $35,614.00 |
| A56 | 8 | Ford | 5 | 8 | AAA | $19,205.00 | $24,016.00 | $43,221.00 |
| A57 | 5 | Ford | 11 | 4 | A | $37,807.00 | $1,976.00 | $39,783.00 |
| A58 | 16 | Toyota | 9 | 7 | AAA | $26,100.00 | $21,723.00 | $47,823.00 |
| A59 | 7 | Toyota | 12 | 5 | AA | $43,116.00 | $5,950.00 | $49,066.00 |
| A60 | 8 | Dodge | 14 | 2 | AA+ | $47,992.00 | $9,640.00 | $57,632.00 |
Solution
Management believes that a new dealership can sell 12 new cars each week. What is the 90% confidence interval for expected total profit?
We have to calculate 90% confidende interval for total mean profit.
Here the confidence interval we can calculate by using EXCEL and output as,
$46,434.18
The syntax in EXCEL are
mean = average(column total profit)
standard deviation (s) = stdev(column total profit)
n = count(array total profit)
c = confidence level = 0.95
a = 1 - c
a/2 = 0.05
critical value = tc = tinv( probability , d.f.)
where probability = 0.05
d.f. = n - 1
The 90% confidence interval for mean is,
mean - E < mu < mean + E
where E is the margin of error.
E = tc * s /sqrt(n)
lower limit = mean - E
upper limit = mean + E
90% confidence interval for mean is, ($38926.92 , $46434.18)
Hypothesisi for the test is,
H0 : rho = 0 Vs H1 : rho 0
the test statistic is ,
t = r * sqrt(n-2) / sqrt(1-r2 )
where r is the correlation coefficient between number of new cars sold each week is not a good predictor of profit b
r = - 0.2234
coefficient of determination is r2 = 0.05
alpha = 0.05
p-value = tdist(x,d.f. ,tails)
where x is test statistic value
d.f. = n - 2
tails = 2
p-value > alpha
Fail to reject H0 at 5% level of significance.
it can’t be said that the population coefficient of determination is statistically different from zero at the 0.05 level.
So option D) is correct for second one.
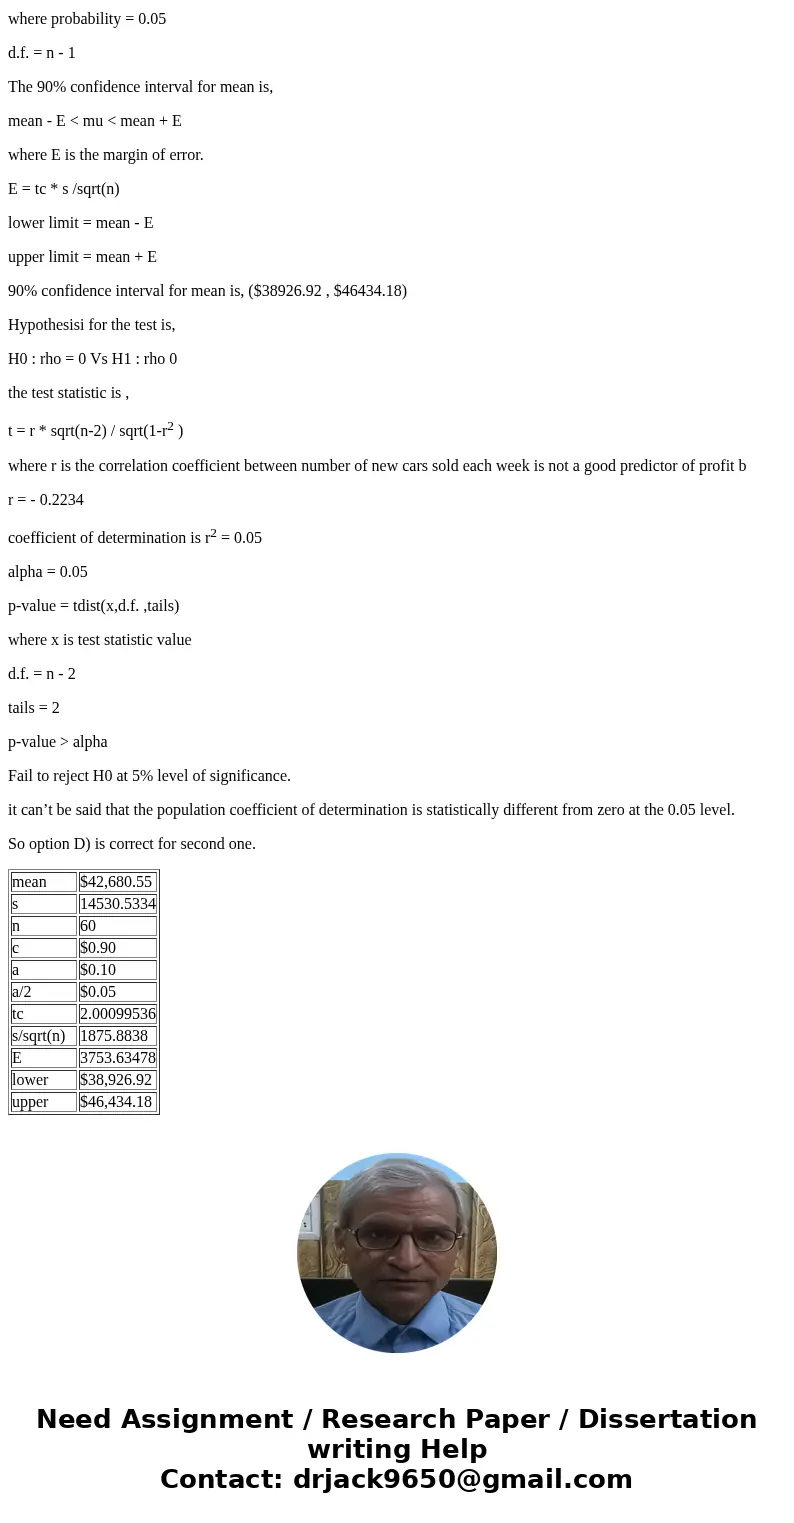
| mean | $42,680.55 |
| s | 14530.5334 |
| n | 60 |
| c | $0.90 |
| a | $0.10 |
| a/2 | $0.05 |
| tc | 2.00099536 |
| s/sqrt(n) | 1875.8838 |
| E | 3753.63478 |
| lower | $38,926.92 |
| upper | $46,434.18 |


 Homework Sourse