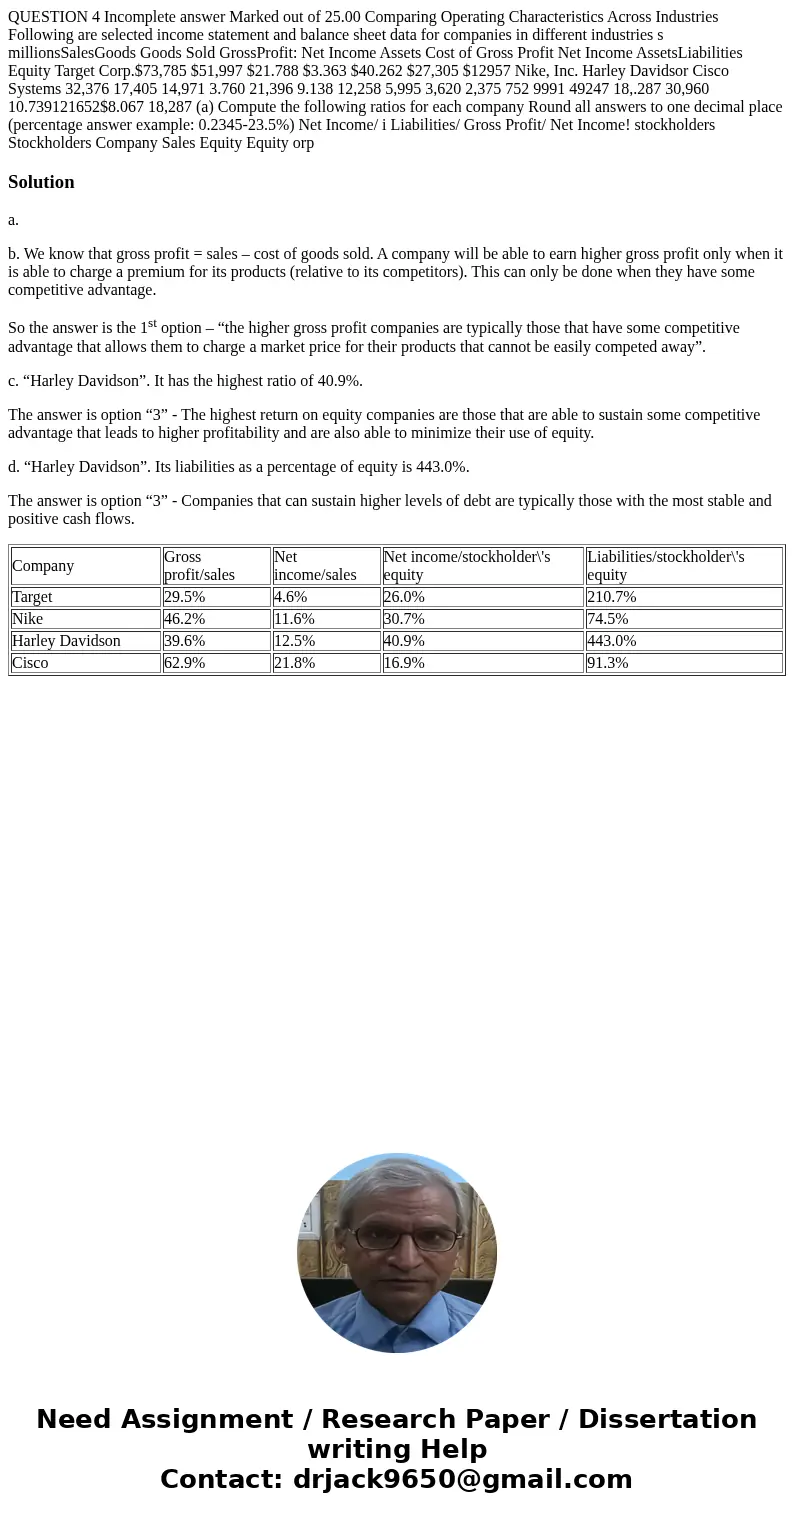
QUESTION 4 Incomplete answer Marked out of 2500 Comparing Op
Solution
a.
b. We know that gross profit = sales – cost of goods sold. A company will be able to earn higher gross profit only when it is able to charge a premium for its products (relative to its competitors). This can only be done when they have some competitive advantage.
So the answer is the 1st option – “the higher gross profit companies are typically those that have some competitive advantage that allows them to charge a market price for their products that cannot be easily competed away”.
c. “Harley Davidson”. It has the highest ratio of 40.9%.
The answer is option “3” - The highest return on equity companies are those that are able to sustain some competitive advantage that leads to higher profitability and are also able to minimize their use of equity.
d. “Harley Davidson”. Its liabilities as a percentage of equity is 443.0%.
The answer is option “3” - Companies that can sustain higher levels of debt are typically those with the most stable and positive cash flows.
| Company | Gross profit/sales | Net income/sales | Net income/stockholder\'s equity | Liabilities/stockholder\'s equity |
| Target | 29.5% | 4.6% | 26.0% | 210.7% |
| Nike | 46.2% | 11.6% | 30.7% | 74.5% |
| Harley Davidson | 39.6% | 12.5% | 40.9% | 443.0% |
| Cisco | 62.9% | 21.8% | 16.9% | 91.3% |

 Homework Sourse