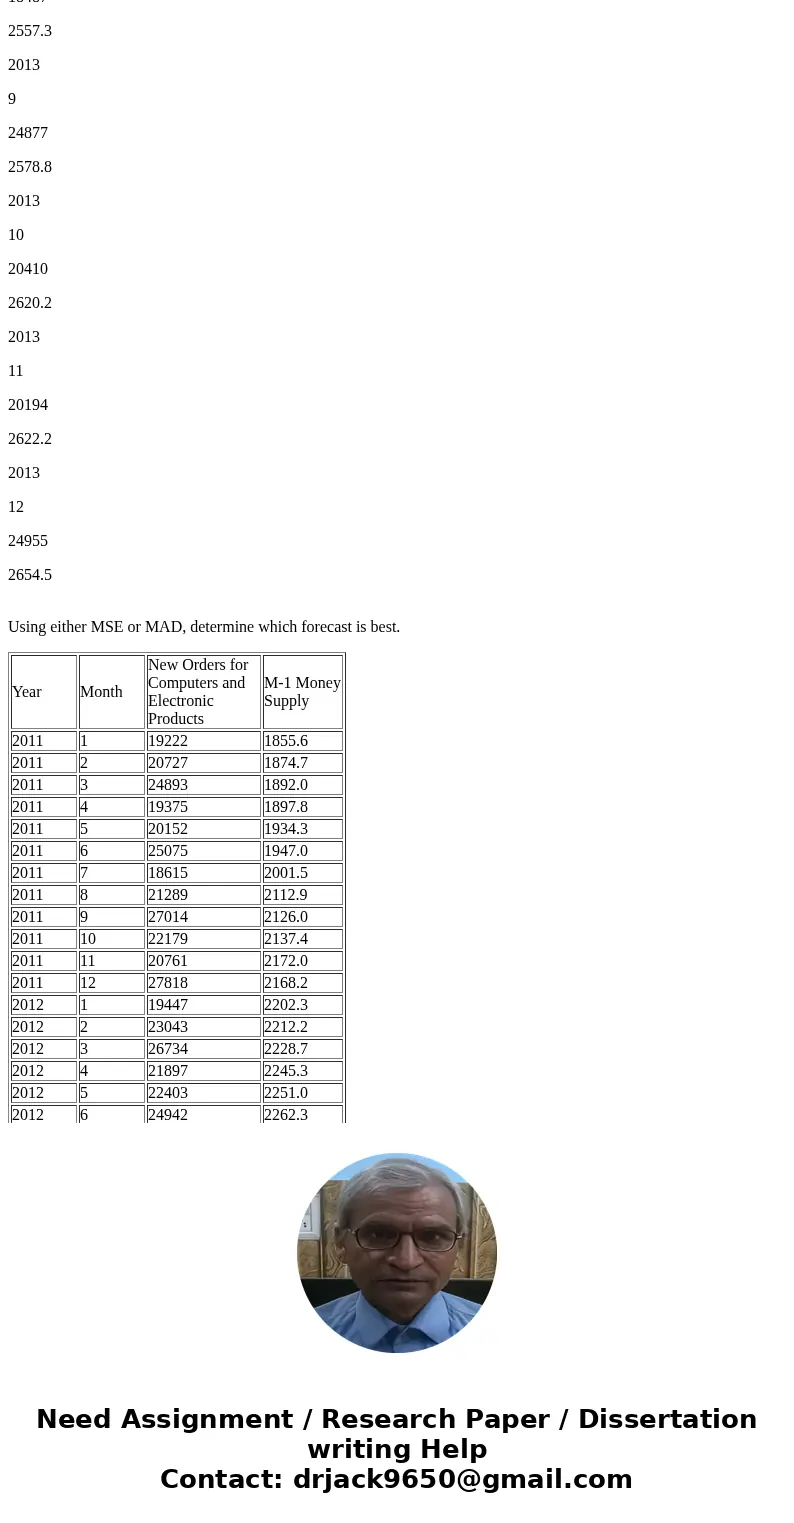
Consider the data on new orders for computers and electronic
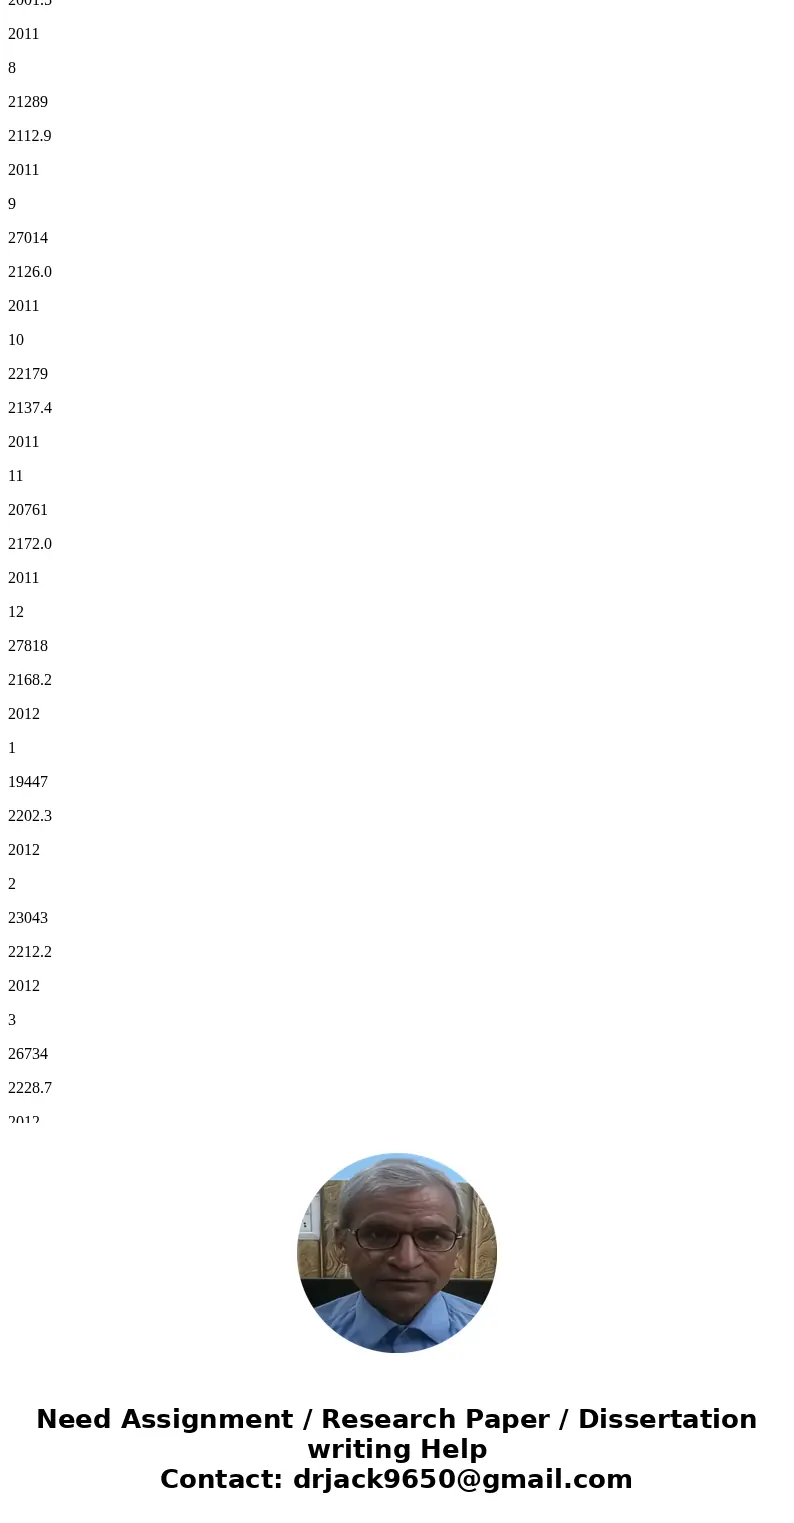
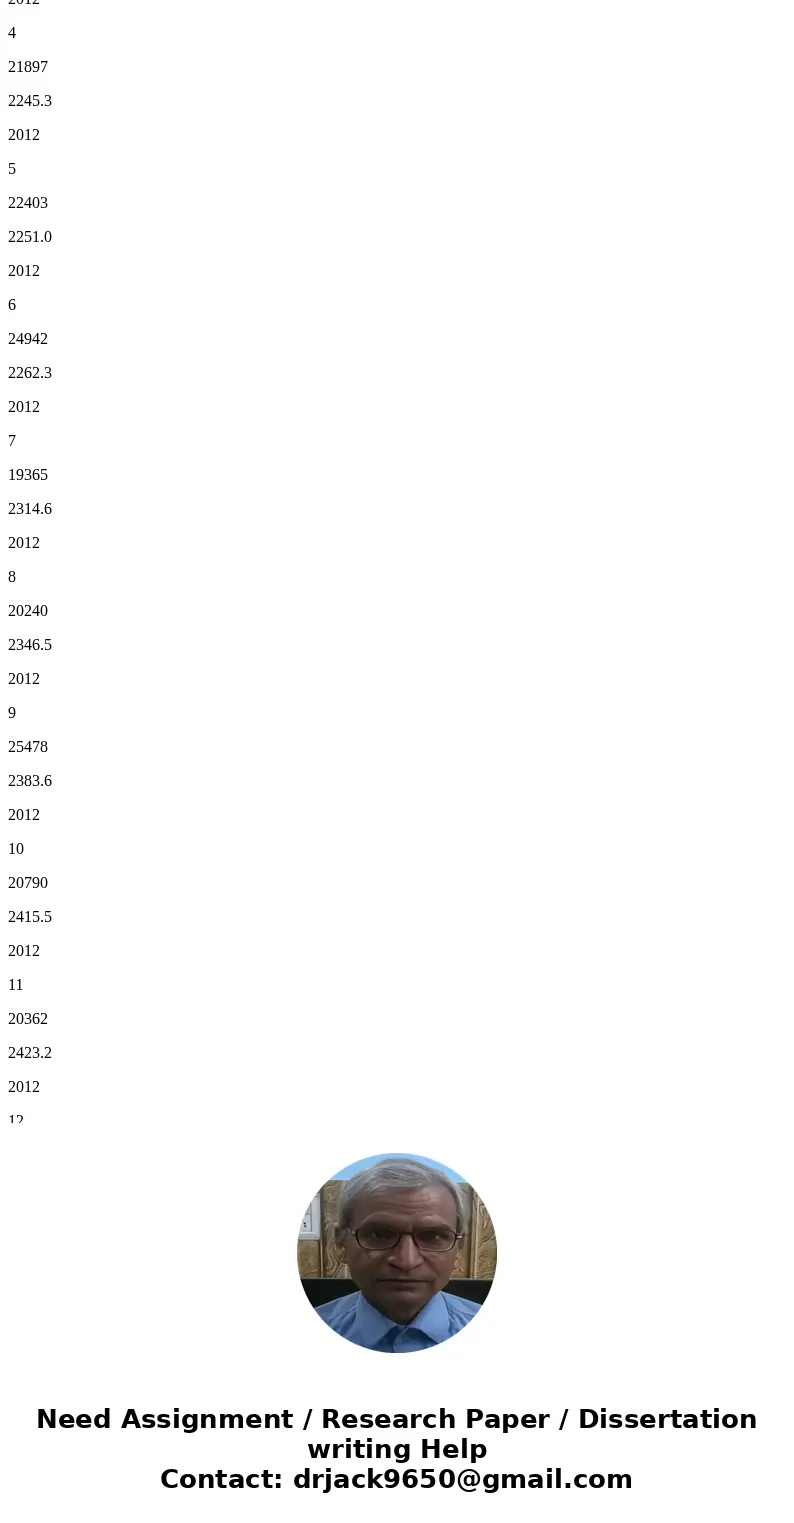
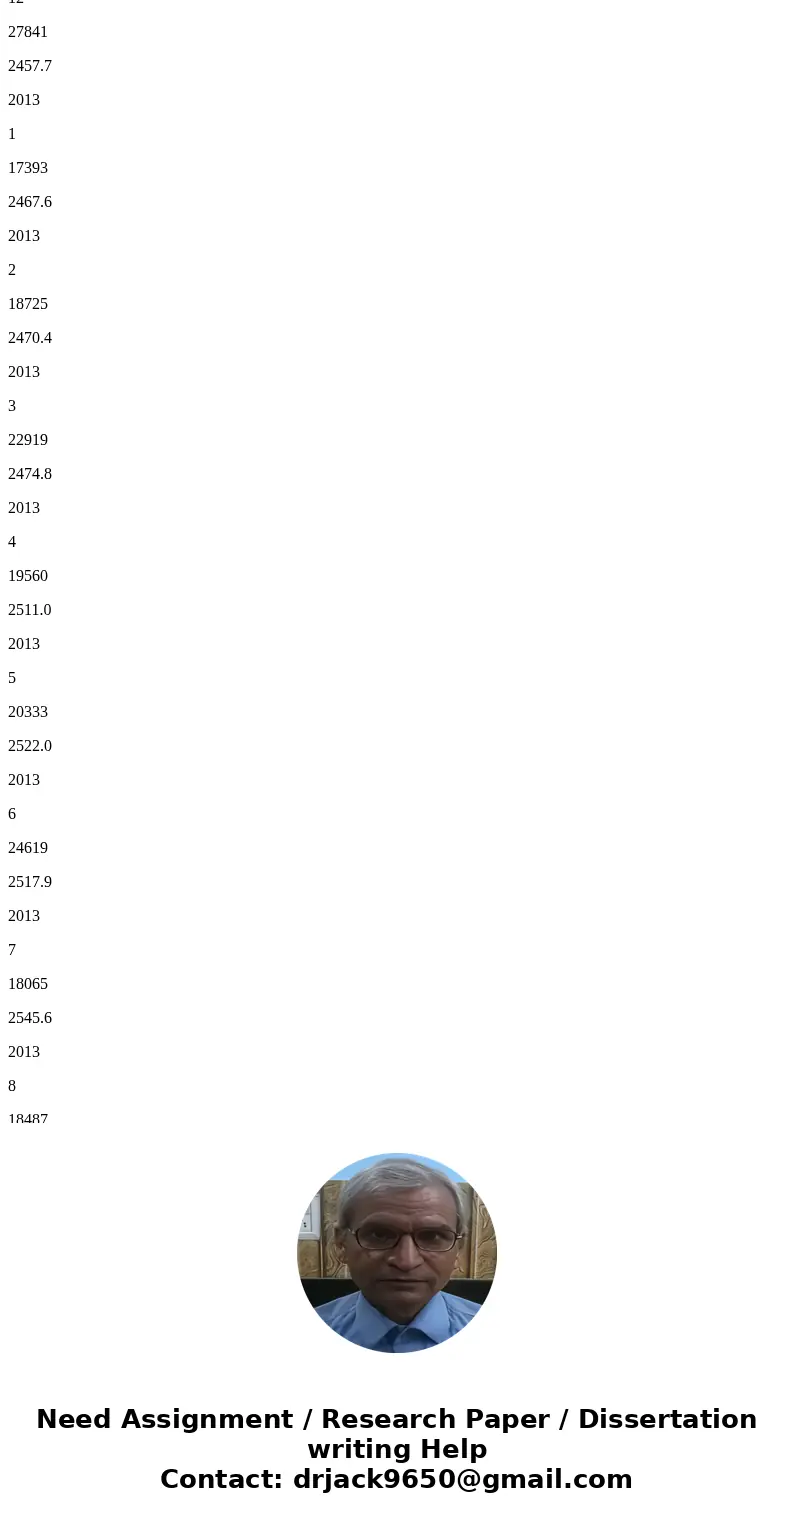
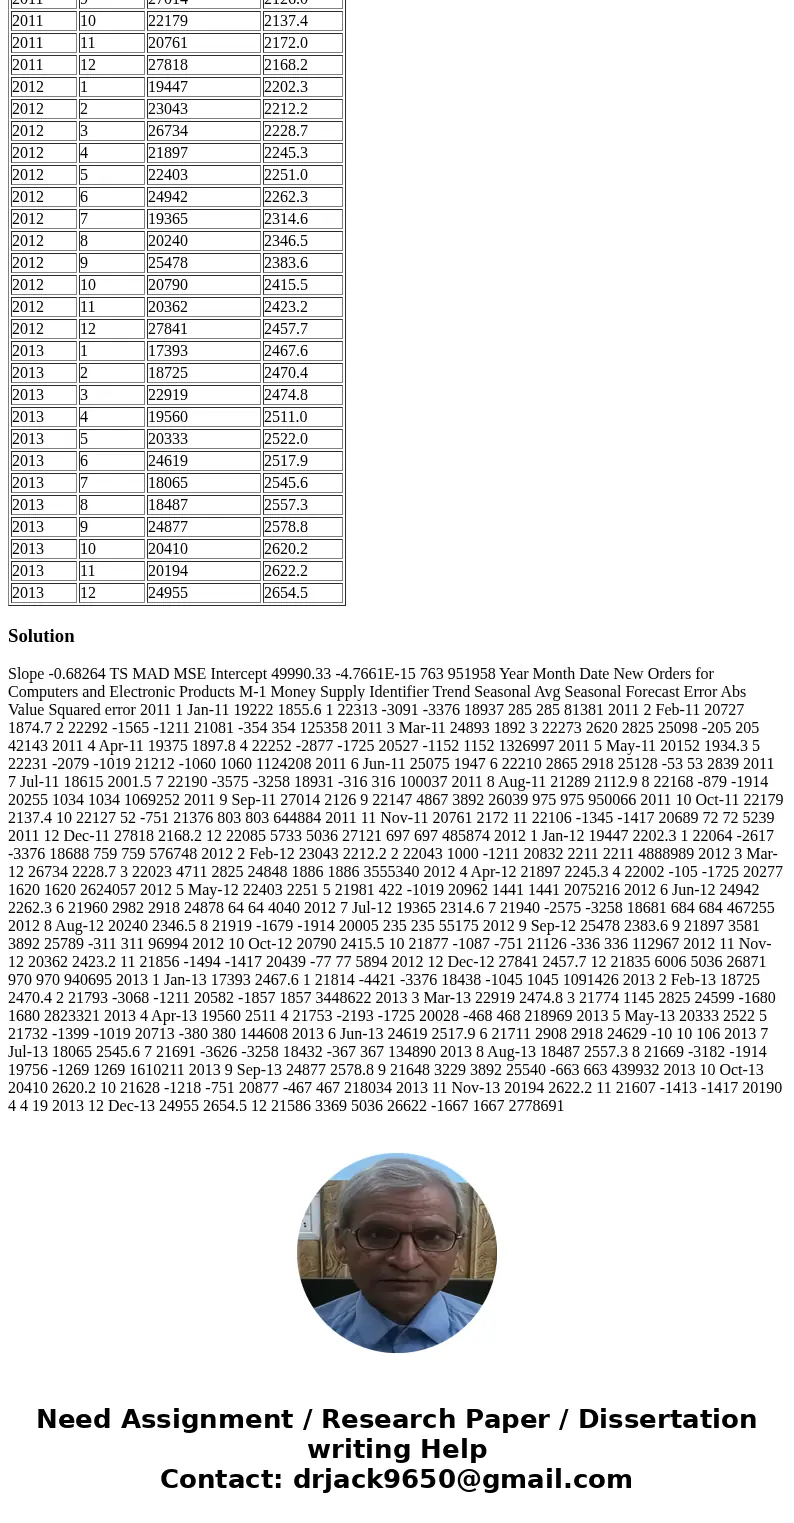
Consider the data on new orders for computers and electronic products and the M1 money supply for the years 2011 through 2014.
Year
Month
New Orders for Computers and Electronic Products
M-1 Money Supply
2011
1
19222
1855.6
2011
2
20727
1874.7
2011
3
24893
1892.0
2011
4
19375
1897.8
2011
5
20152
1934.3
2011
6
25075
1947.0
2011
7
18615
2001.5
2011
8
21289
2112.9
2011
9
27014
2126.0
2011
10
22179
2137.4
2011
11
20761
2172.0
2011
12
27818
2168.2
2012
1
19447
2202.3
2012
2
23043
2212.2
2012
3
26734
2228.7
2012
4
21897
2245.3
2012
5
22403
2251.0
2012
6
24942
2262.3
2012
7
19365
2314.6
2012
8
20240
2346.5
2012
9
25478
2383.6
2012
10
20790
2415.5
2012
11
20362
2423.2
2012
12
27841
2457.7
2013
1
17393
2467.6
2013
2
18725
2470.4
2013
3
22919
2474.8
2013
4
19560
2511.0
2013
5
20333
2522.0
2013
6
24619
2517.9
2013
7
18065
2545.6
2013
8
18487
2557.3
2013
9
24877
2578.8
2013
10
20410
2620.2
2013
11
20194
2622.2
2013
12
24955
2654.5
Using either MSE or MAD, determine which forecast is best.
| Year | Month | New Orders for Computers and Electronic Products | M-1 Money Supply |
| 2011 | 1 | 19222 | 1855.6 |
| 2011 | 2 | 20727 | 1874.7 |
| 2011 | 3 | 24893 | 1892.0 |
| 2011 | 4 | 19375 | 1897.8 |
| 2011 | 5 | 20152 | 1934.3 |
| 2011 | 6 | 25075 | 1947.0 |
| 2011 | 7 | 18615 | 2001.5 |
| 2011 | 8 | 21289 | 2112.9 |
| 2011 | 9 | 27014 | 2126.0 |
| 2011 | 10 | 22179 | 2137.4 |
| 2011 | 11 | 20761 | 2172.0 |
| 2011 | 12 | 27818 | 2168.2 |
| 2012 | 1 | 19447 | 2202.3 |
| 2012 | 2 | 23043 | 2212.2 |
| 2012 | 3 | 26734 | 2228.7 |
| 2012 | 4 | 21897 | 2245.3 |
| 2012 | 5 | 22403 | 2251.0 |
| 2012 | 6 | 24942 | 2262.3 |
| 2012 | 7 | 19365 | 2314.6 |
| 2012 | 8 | 20240 | 2346.5 |
| 2012 | 9 | 25478 | 2383.6 |
| 2012 | 10 | 20790 | 2415.5 |
| 2012 | 11 | 20362 | 2423.2 |
| 2012 | 12 | 27841 | 2457.7 |
| 2013 | 1 | 17393 | 2467.6 |
| 2013 | 2 | 18725 | 2470.4 |
| 2013 | 3 | 22919 | 2474.8 |
| 2013 | 4 | 19560 | 2511.0 |
| 2013 | 5 | 20333 | 2522.0 |
| 2013 | 6 | 24619 | 2517.9 |
| 2013 | 7 | 18065 | 2545.6 |
| 2013 | 8 | 18487 | 2557.3 |
| 2013 | 9 | 24877 | 2578.8 |
| 2013 | 10 | 20410 | 2620.2 |
| 2013 | 11 | 20194 | 2622.2 |
| 2013 | 12 | 24955 | 2654.5 |
Solution
Slope -0.68264 TS MAD MSE Intercept 49990.33 -4.7661E-15 763 951958 Year Month Date New Orders for Computers and Electronic Products M-1 Money Supply Identifier Trend Seasonal Avg Seasonal Forecast Error Abs Value Squared error 2011 1 Jan-11 19222 1855.6 1 22313 -3091 -3376 18937 285 285 81381 2011 2 Feb-11 20727 1874.7 2 22292 -1565 -1211 21081 -354 354 125358 2011 3 Mar-11 24893 1892 3 22273 2620 2825 25098 -205 205 42143 2011 4 Apr-11 19375 1897.8 4 22252 -2877 -1725 20527 -1152 1152 1326997 2011 5 May-11 20152 1934.3 5 22231 -2079 -1019 21212 -1060 1060 1124208 2011 6 Jun-11 25075 1947 6 22210 2865 2918 25128 -53 53 2839 2011 7 Jul-11 18615 2001.5 7 22190 -3575 -3258 18931 -316 316 100037 2011 8 Aug-11 21289 2112.9 8 22168 -879 -1914 20255 1034 1034 1069252 2011 9 Sep-11 27014 2126 9 22147 4867 3892 26039 975 975 950066 2011 10 Oct-11 22179 2137.4 10 22127 52 -751 21376 803 803 644884 2011 11 Nov-11 20761 2172 11 22106 -1345 -1417 20689 72 72 5239 2011 12 Dec-11 27818 2168.2 12 22085 5733 5036 27121 697 697 485874 2012 1 Jan-12 19447 2202.3 1 22064 -2617 -3376 18688 759 759 576748 2012 2 Feb-12 23043 2212.2 2 22043 1000 -1211 20832 2211 2211 4888989 2012 3 Mar-12 26734 2228.7 3 22023 4711 2825 24848 1886 1886 3555340 2012 4 Apr-12 21897 2245.3 4 22002 -105 -1725 20277 1620 1620 2624057 2012 5 May-12 22403 2251 5 21981 422 -1019 20962 1441 1441 2075216 2012 6 Jun-12 24942 2262.3 6 21960 2982 2918 24878 64 64 4040 2012 7 Jul-12 19365 2314.6 7 21940 -2575 -3258 18681 684 684 467255 2012 8 Aug-12 20240 2346.5 8 21919 -1679 -1914 20005 235 235 55175 2012 9 Sep-12 25478 2383.6 9 21897 3581 3892 25789 -311 311 96994 2012 10 Oct-12 20790 2415.5 10 21877 -1087 -751 21126 -336 336 112967 2012 11 Nov-12 20362 2423.2 11 21856 -1494 -1417 20439 -77 77 5894 2012 12 Dec-12 27841 2457.7 12 21835 6006 5036 26871 970 970 940695 2013 1 Jan-13 17393 2467.6 1 21814 -4421 -3376 18438 -1045 1045 1091426 2013 2 Feb-13 18725 2470.4 2 21793 -3068 -1211 20582 -1857 1857 3448622 2013 3 Mar-13 22919 2474.8 3 21774 1145 2825 24599 -1680 1680 2823321 2013 4 Apr-13 19560 2511 4 21753 -2193 -1725 20028 -468 468 218969 2013 5 May-13 20333 2522 5 21732 -1399 -1019 20713 -380 380 144608 2013 6 Jun-13 24619 2517.9 6 21711 2908 2918 24629 -10 10 106 2013 7 Jul-13 18065 2545.6 7 21691 -3626 -3258 18432 -367 367 134890 2013 8 Aug-13 18487 2557.3 8 21669 -3182 -1914 19756 -1269 1269 1610211 2013 9 Sep-13 24877 2578.8 9 21648 3229 3892 25540 -663 663 439932 2013 10 Oct-13 20410 2620.2 10 21628 -1218 -751 20877 -467 467 218034 2013 11 Nov-13 20194 2622.2 11 21607 -1413 -1417 20190 4 4 19 2013 12 Dec-13 24955 2654.5 12 21586 3369 5036 26622 -1667 1667 2778691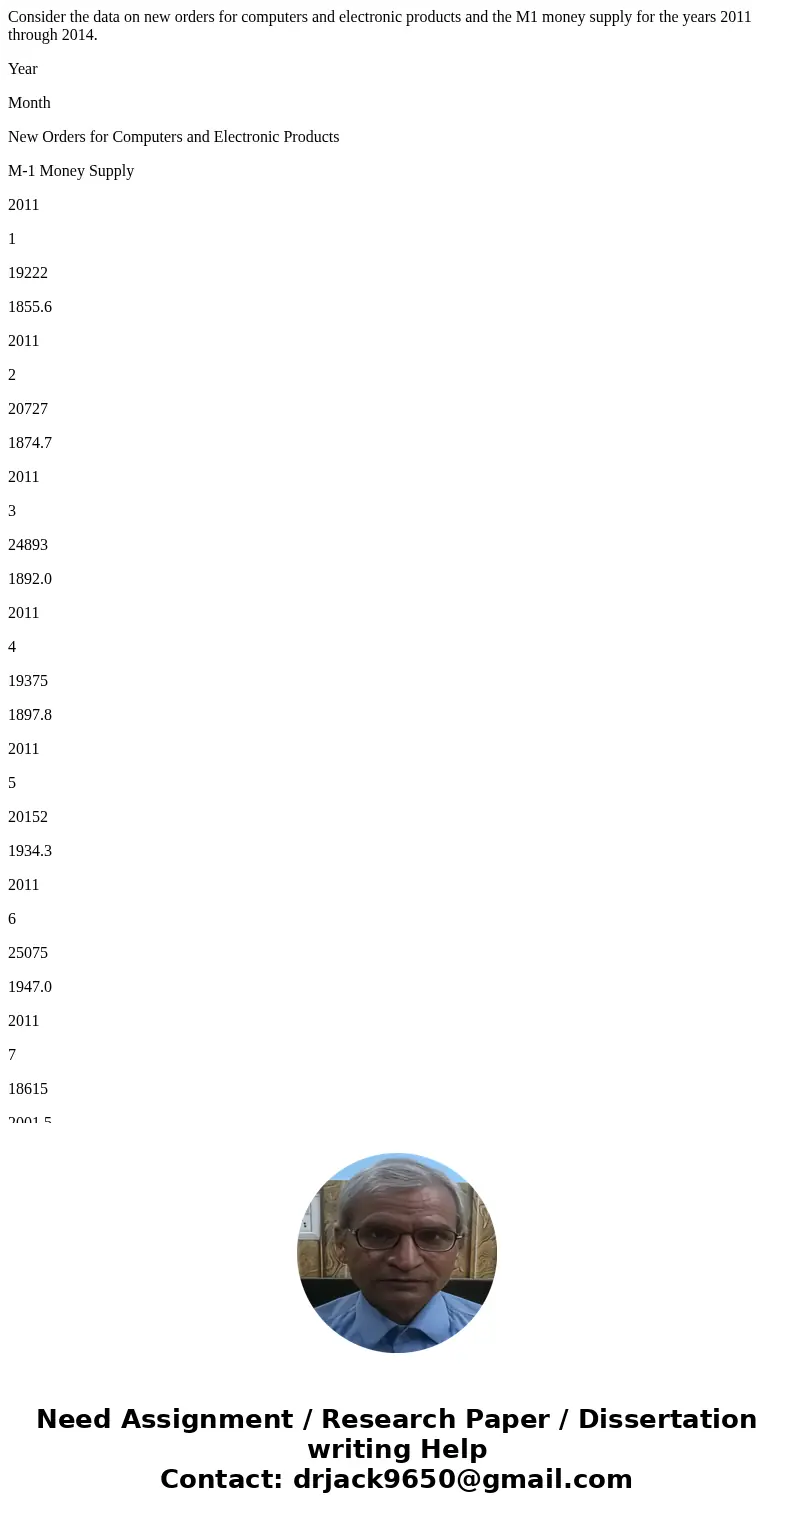
 Homework Sourse