Bone Density Scores of Treatment Group Generate 10 sample va
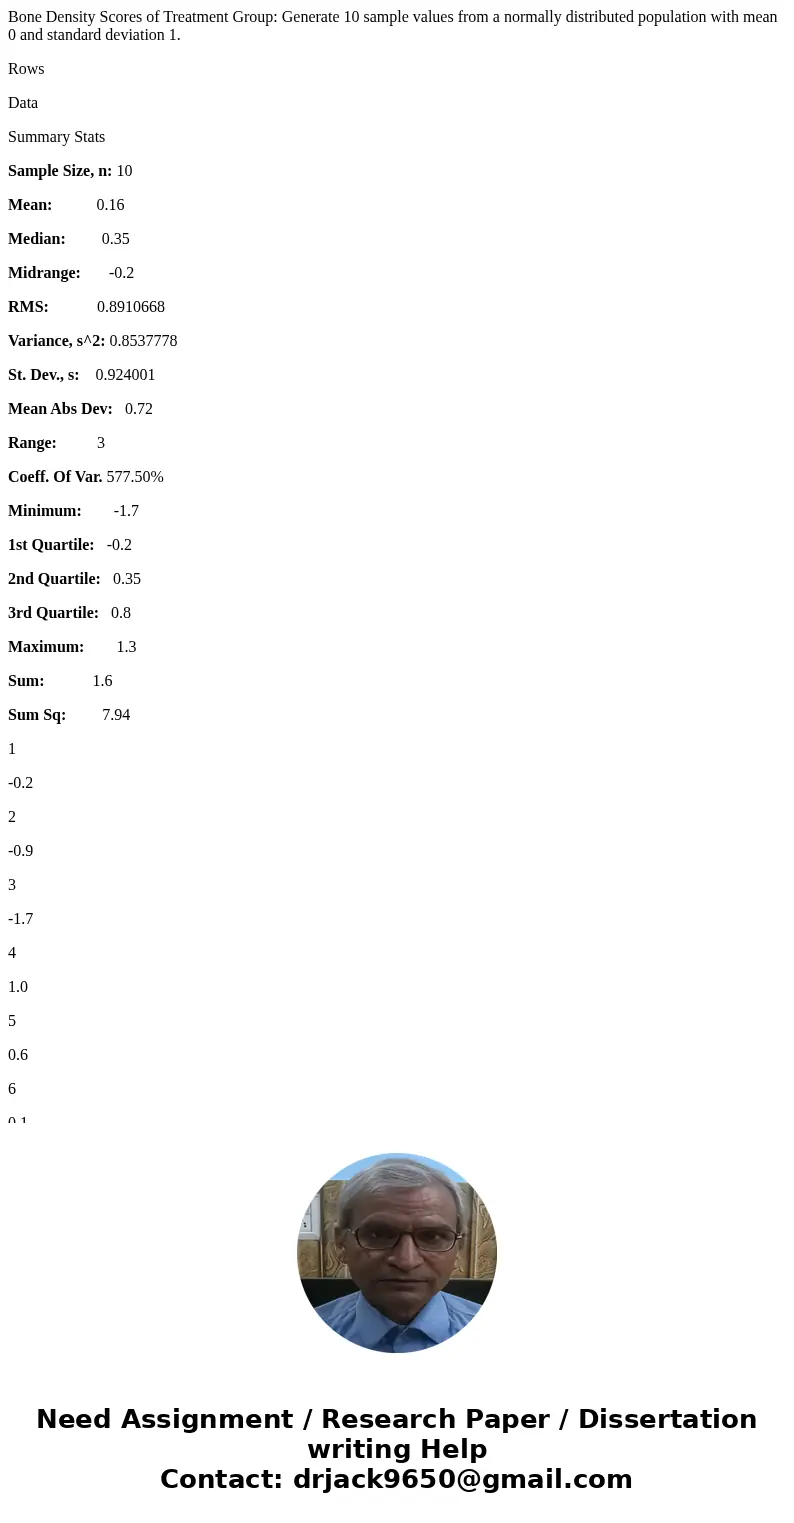
Bone Density Scores of Treatment Group: Generate 10 sample values from a normally distributed population with mean 0 and standard deviation 1.
Rows
Data
Summary Stats
Sample Size, n: 10
Mean: 0.16
Median: 0.35
Midrange: -0.2
RMS: 0.8910668
Variance, s^2: 0.8537778
St. Dev., s: 0.924001
Mean Abs Dev: 0.72
Range: 3
Coeff. Of Var. 577.50%
Minimum: -1.7
1st Quartile: -0.2
2nd Quartile: 0.35
3rd Quartile: 0.8
Maximum: 1.3
Sum: 1.6
Sum Sq: 7.94
1
-0.2
2
-0.9
3
-1.7
4
1.0
5
0.6
6
0.1
7
0.8
8
-0.1
9
0.7
10
1.3
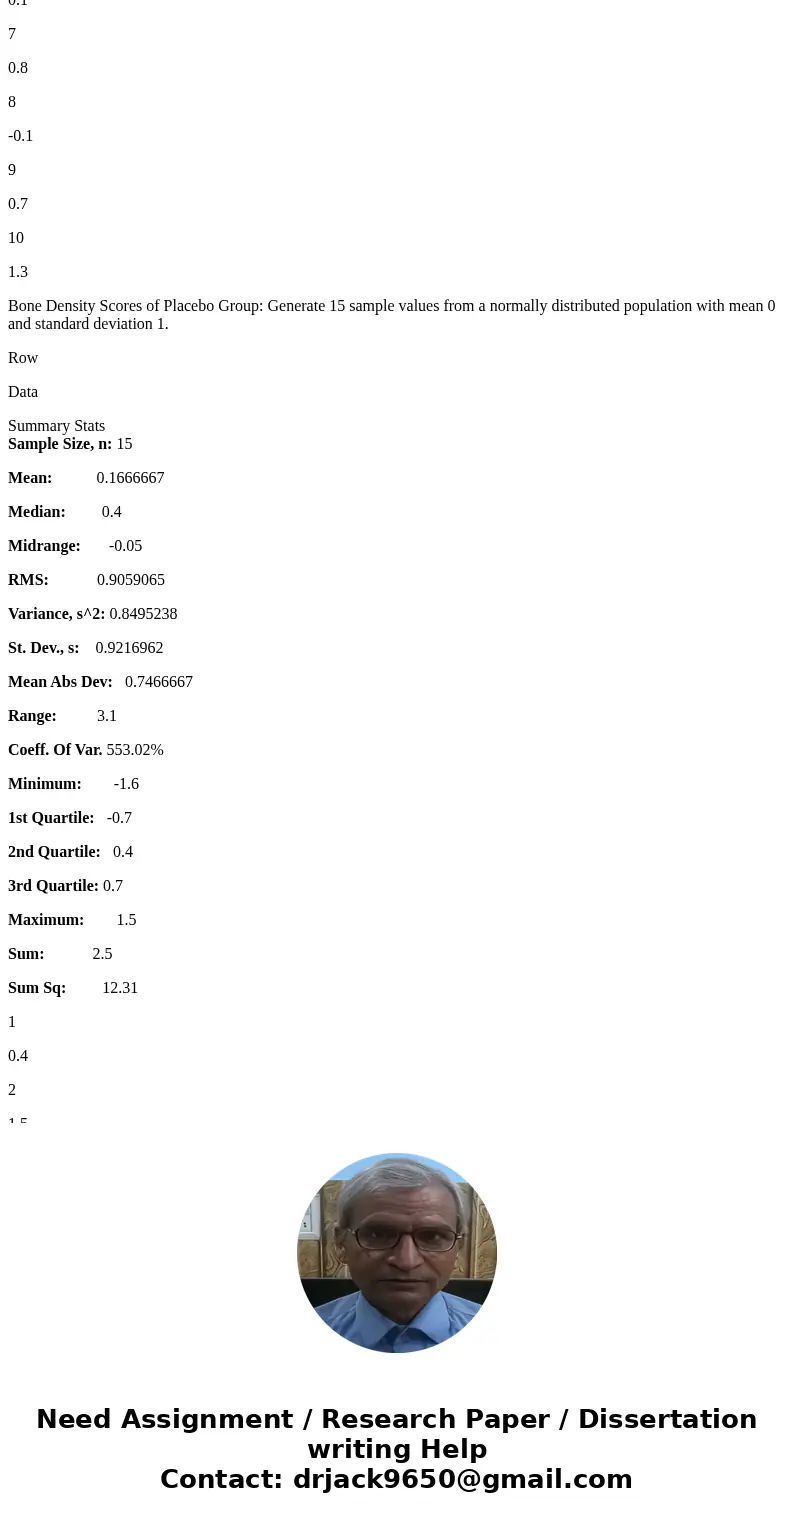
Bone Density Scores of Placebo Group: Generate 15 sample values from a normally distributed population with mean 0 and standard deviation 1.
Row
Data
Summary Stats
Sample Size, n: 15
Mean: 0.1666667
Median: 0.4
Midrange: -0.05
RMS: 0.9059065
Variance, s^2: 0.8495238
St. Dev., s: 0.9216962
Mean Abs Dev: 0.7466667
Range: 3.1
Coeff. Of Var. 553.02%
Minimum: -1.6
1st Quartile: -0.7
2nd Quartile: 0.4
3rd Quartile: 0.7
Maximum: 1.5
Sum: 2.5
Sum Sq: 12.31
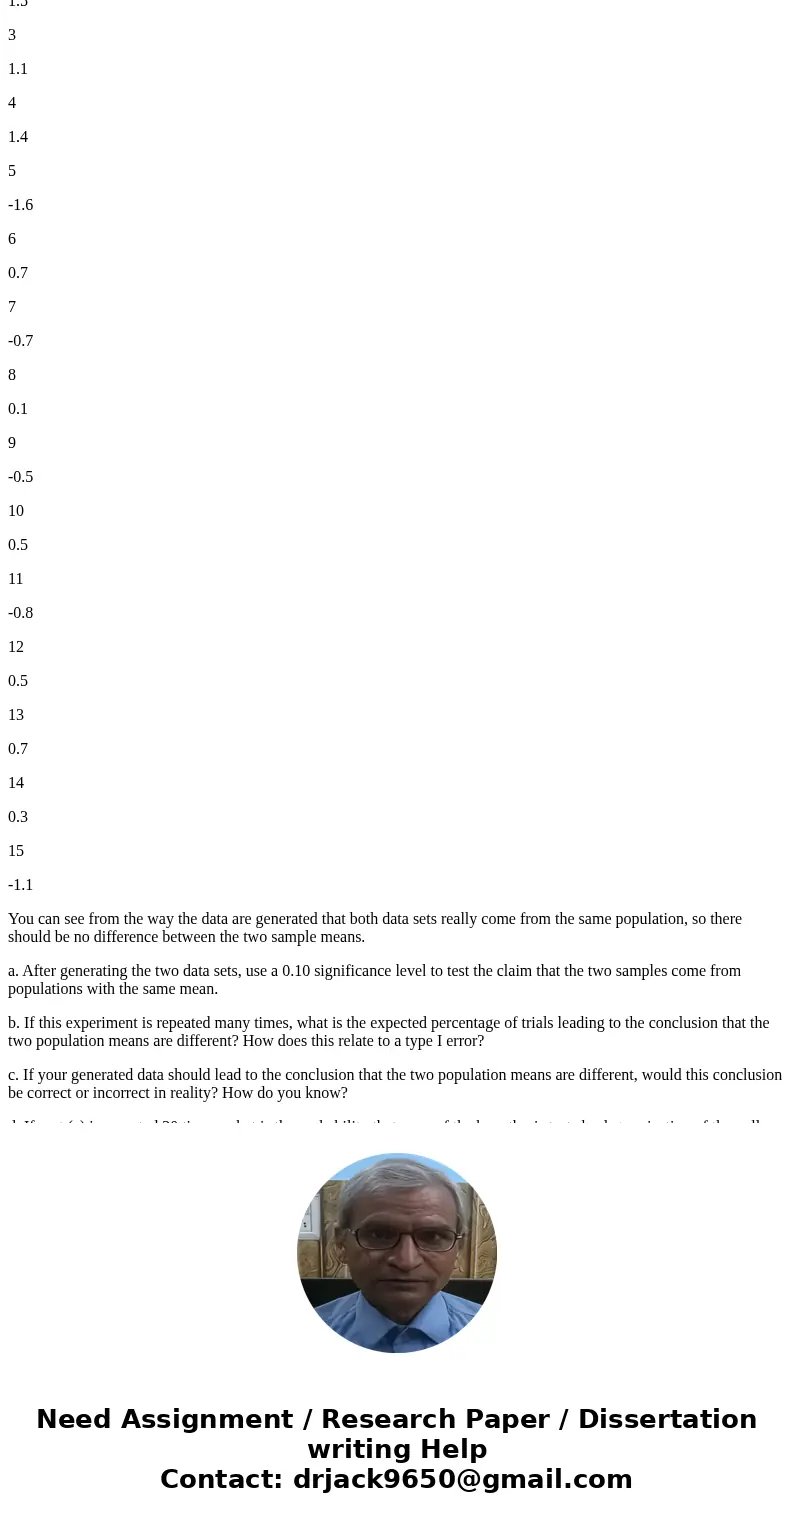
1
0.4
2
1.5
3
1.1
4
1.4
5
-1.6
6
0.7
7
-0.7
8
0.1
9
-0.5
10
0.5
11
-0.8
12
0.5
13
0.7
14
0.3
15
-1.1
You can see from the way the data are generated that both data sets really come from the same population, so there should be no difference between the two sample means.
a. After generating the two data sets, use a 0.10 significance level to test the claim that the two samples come from populations with the same mean.
b. If this experiment is repeated many times, what is the expected percentage of trials leading to the conclusion that the two population means are different? How does this relate to a type I error?
c. If your generated data should lead to the conclusion that the two population means are different, would this conclusion be correct or incorrect in reality? How do you know?
d. If part (a) is repeated 20 times, what is the probability that none of the hypothesis tests leads to rejection of the null hypothesis?
e. Repeat part (a) 20 times. How often was the null hypothesis of equal means rejected? Is this the result you expected?
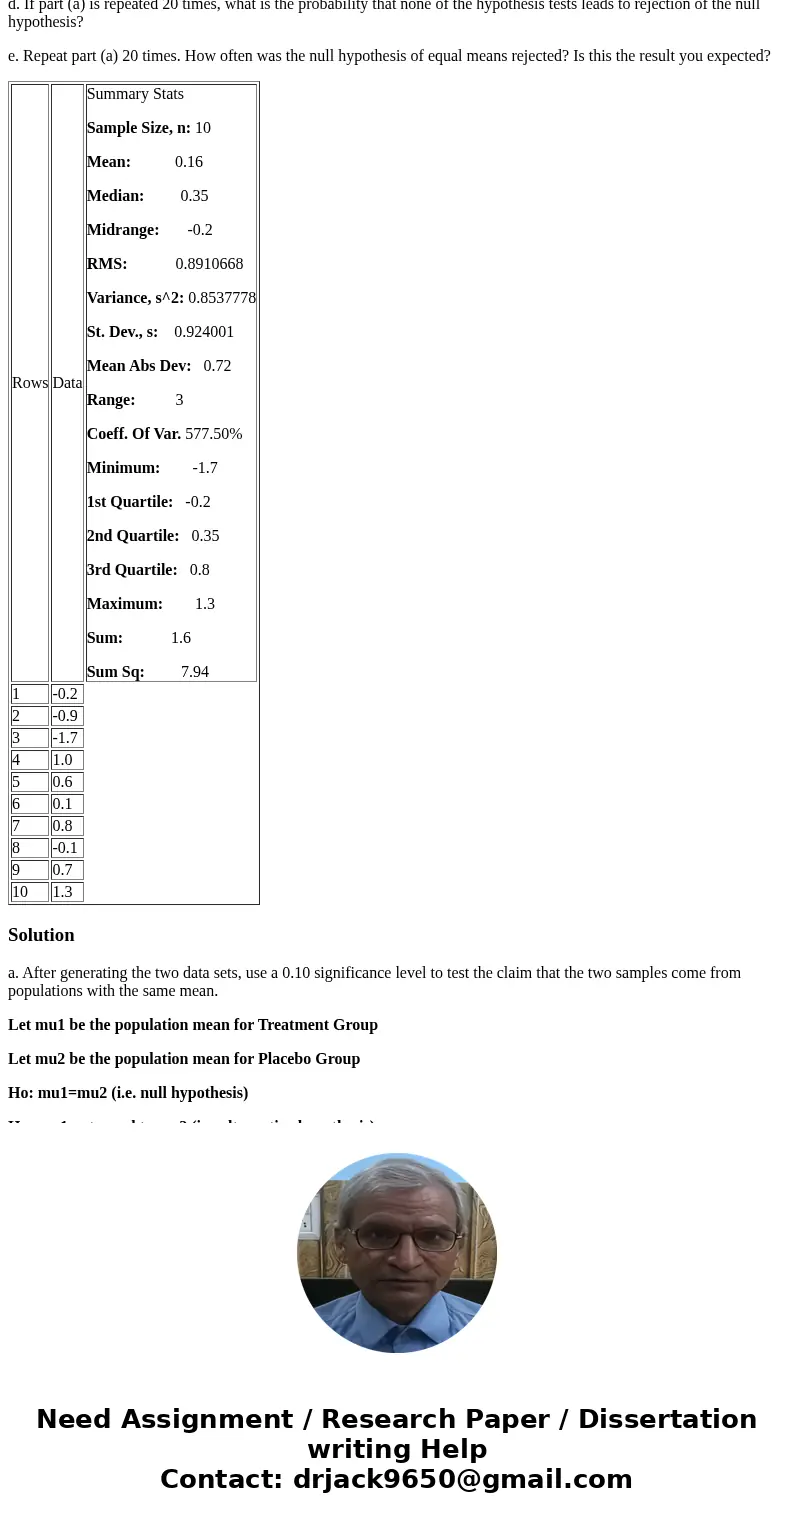
| Rows | Data | Summary Stats Sample Size, n: 10 Mean: 0.16 Median: 0.35 Midrange: -0.2 RMS: 0.8910668 Variance, s^2: 0.8537778 St. Dev., s: 0.924001 Mean Abs Dev: 0.72 Range: 3 Coeff. Of Var. 577.50% Minimum: -1.7 1st Quartile: -0.2 2nd Quartile: 0.35 3rd Quartile: 0.8 Maximum: 1.3 Sum: 1.6 Sum Sq: 7.94 |
| 1 | -0.2 | |
| 2 | -0.9 | |
| 3 | -1.7 | |
| 4 | 1.0 | |
| 5 | 0.6 | |
| 6 | 0.1 | |
| 7 | 0.8 | |
| 8 | -0.1 | |
| 9 | 0.7 | |
| 10 | 1.3 |
Solution
a. After generating the two data sets, use a 0.10 significance level to test the claim that the two samples come from populations with the same mean.
Let mu1 be the population mean for Treatment Group
Let mu2 be the population mean for Placebo Group
Ho: mu1=mu2 (i.e. null hypothesis)
Ha: mu1 not equal to mu2 (i.e. alternative hypothesis)
The test statistic is
Z=(xbar1-xbar2)/sqrt(s1^2/n1+s2^2/n2)
=(0.16-0.1666667)/sqrt(0.8537778/10+0.8495238/15)
=-0.02
It is a two-tailed test.
Given a=0.1, the critical values are Z(0.05) =-1.645 or 1.645 (from standard normal table)
The rejection regions are if Z<-1.645 or Z>1.645, we reject the null hypothesis.
Since Z=-0.02 is between -1.645 and 1.645, we do not reject the null hypothesis.
So we can conclude that the two samples come from populations with the same mean.
---------------------------------------------------------------------------------------------------------------------------
b. If this experiment is repeated many times, what is the expected percentage of trials leading to the conclusion that the two population means are different? How does this relate to a type I error?
The expected percentage is 0.9
Type I error: We reject the null hypothesis when it is true.
---------------------------------------------------------------------------------------------------------------------------
c. If your generated data should lead to the conclusion that the two population means are different, would this conclusion be correct or incorrect in reality? How do you know?
This conclusion would be correct in reality because it may lead the different means.
---------------------------------------------------------------------------------------------------------------------------
d. If part (a) is repeated 20 times, what is the probability that none of the hypothesis tests leads to rejection of the null hypothesis?
The probability is close to 1
---------------------------------------------------------------------------------------------------------------------------
e. Repeat part (a) 20 times. How often was the null hypothesis of equal means rejected? Is this the result you expected?
20*0.1=2
Yes, this result is I expected.
 Homework Sourse