Consider the following competing hypotheses and accompanying
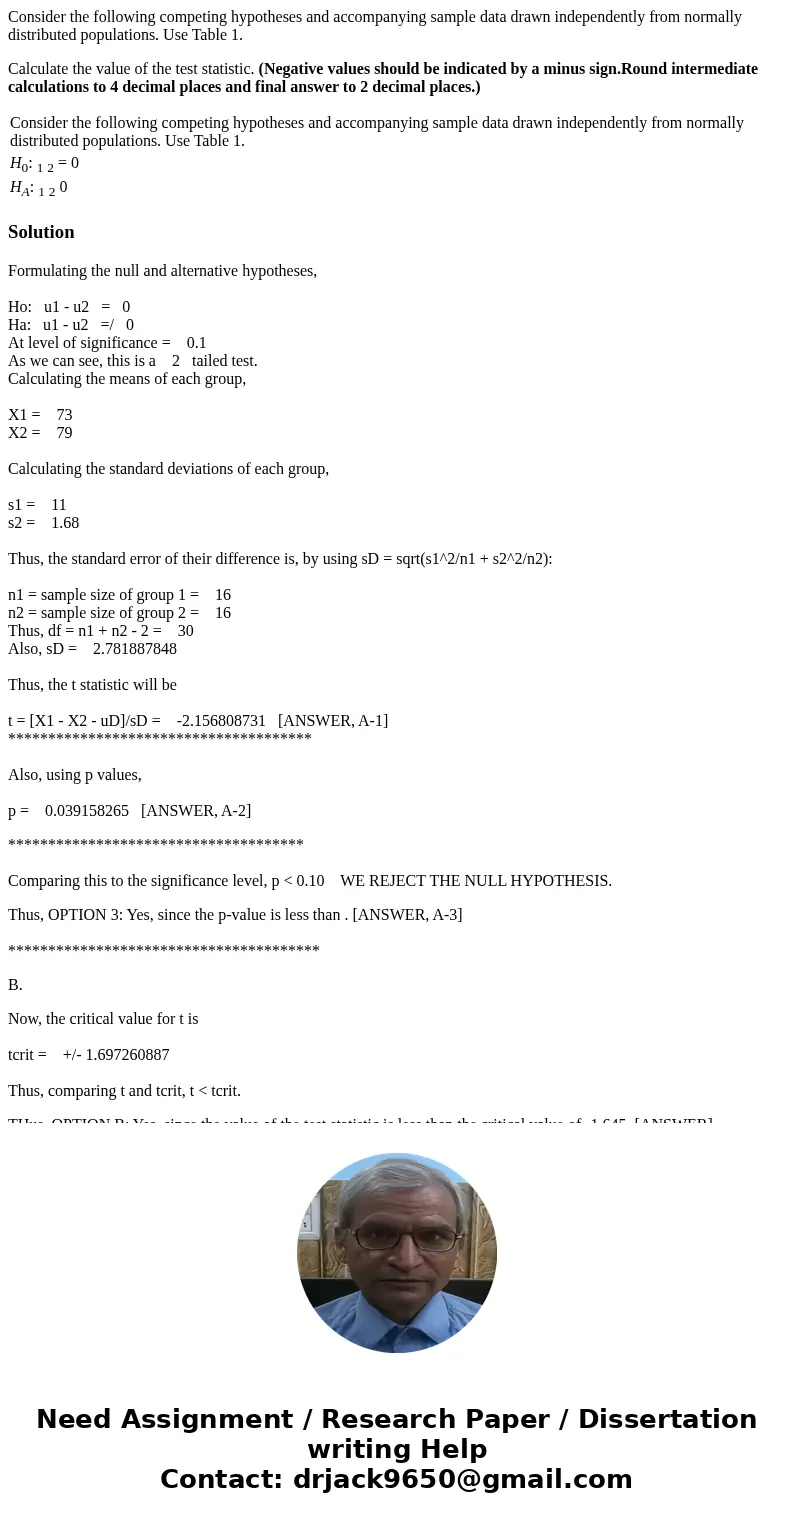
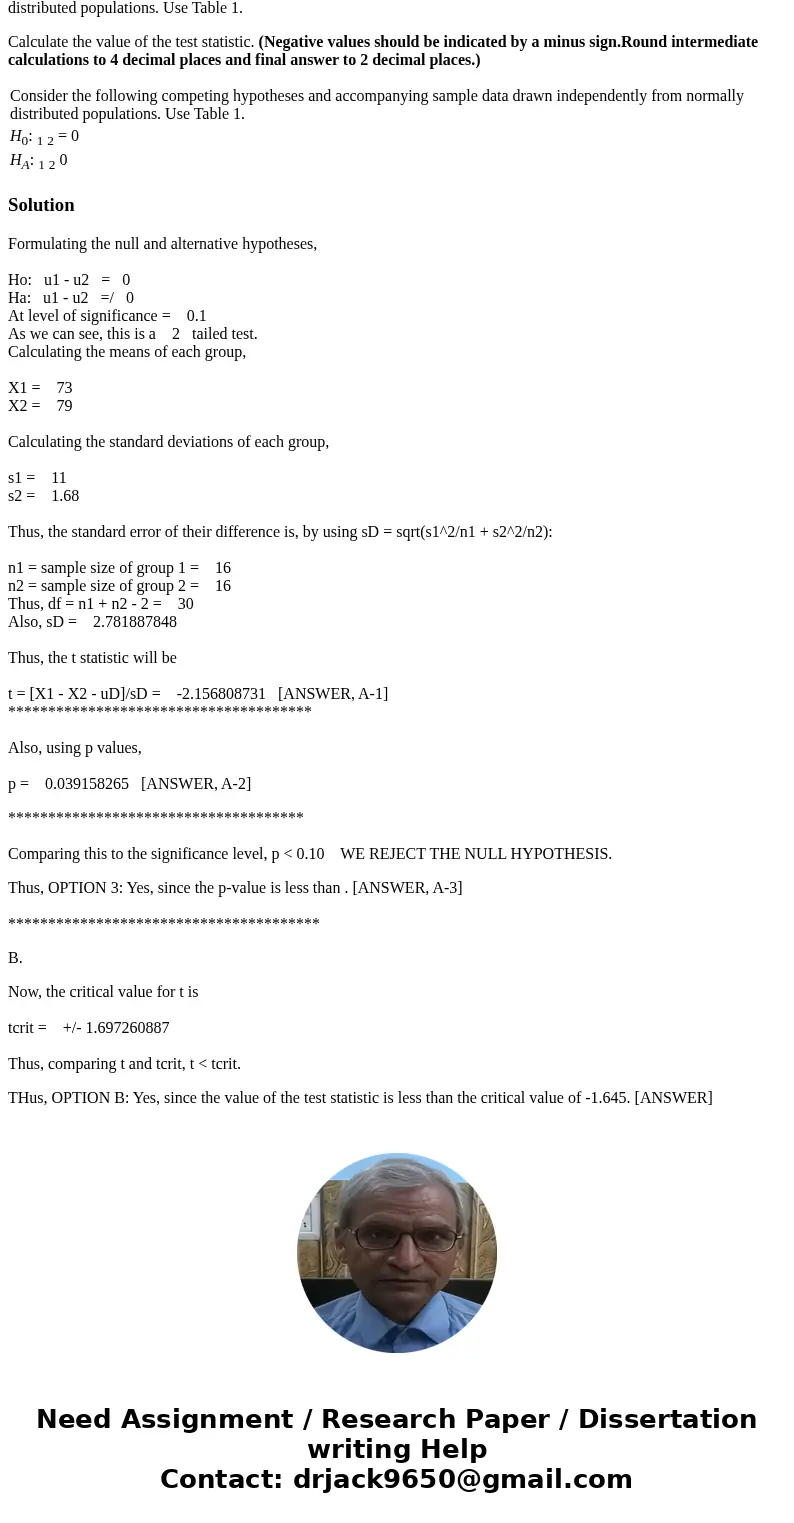
Consider the following competing hypotheses and accompanying sample data drawn independently from normally distributed populations. Use Table 1.
Calculate the value of the test statistic. (Negative values should be indicated by a minus sign.Round intermediate calculations to 4 decimal places and final answer to 2 decimal places.)
| Consider the following competing hypotheses and accompanying sample data drawn independently from normally distributed populations. Use Table 1. |
| H0: 1 2 = 0 |
| HA: 1 2 0 |
Solution
Formulating the null and alternative hypotheses,
Ho: u1 - u2 = 0
Ha: u1 - u2 =/ 0
At level of significance = 0.1
As we can see, this is a 2 tailed test.
Calculating the means of each group,
X1 = 73
X2 = 79
Calculating the standard deviations of each group,
s1 = 11
s2 = 1.68
Thus, the standard error of their difference is, by using sD = sqrt(s1^2/n1 + s2^2/n2):
n1 = sample size of group 1 = 16
n2 = sample size of group 2 = 16
Thus, df = n1 + n2 - 2 = 30
Also, sD = 2.781887848
Thus, the t statistic will be
t = [X1 - X2 - uD]/sD = -2.156808731 [ANSWER, A-1]
**************************************
Also, using p values,
p = 0.039158265 [ANSWER, A-2]
*************************************
Comparing this to the significance level, p < 0.10 WE REJECT THE NULL HYPOTHESIS.
Thus, OPTION 3: Yes, since the p-value is less than . [ANSWER, A-3]
***************************************
B.
Now, the critical value for t is
tcrit = +/- 1.697260887
Thus, comparing t and tcrit, t < tcrit.
THus, OPTION B: Yes, since the value of the test statistic is less than the critical value of -1.645. [ANSWER]


 Homework Sourse