Construct a halfNormal probability plot to determine if the
Construct a half-Normal probability plot to determine if the data below come from a normal distribution. Make sure to explain your conclusion.

Solution
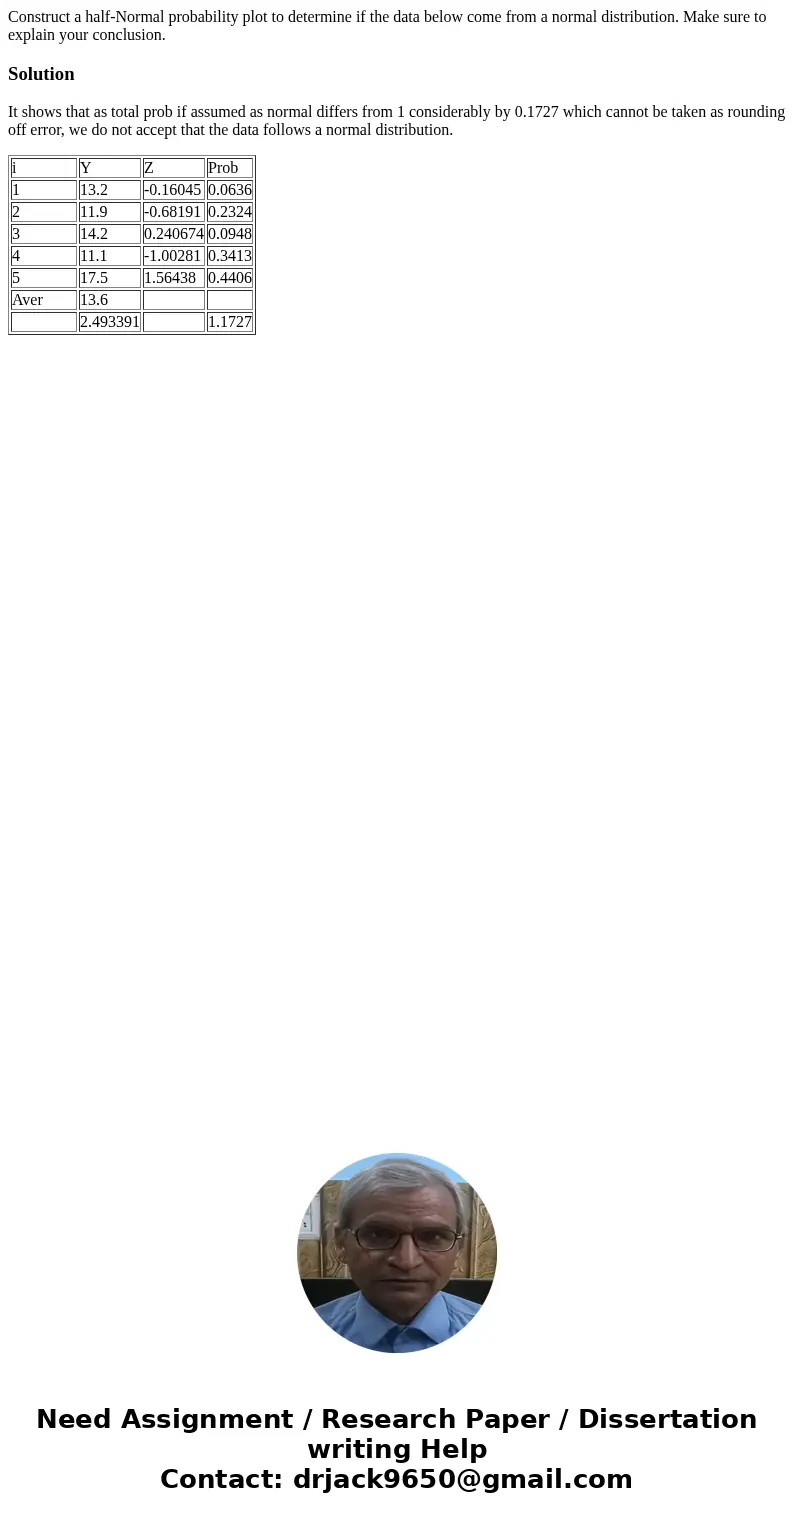
It shows that as total prob if assumed as normal differs from 1 considerably by 0.1727 which cannot be taken as rounding off error, we do not accept that the data follows a normal distribution.
| i | Y | Z | Prob |
| 1 | 13.2 | -0.16045 | 0.0636 |
| 2 | 11.9 | -0.68191 | 0.2324 |
| 3 | 14.2 | 0.240674 | 0.0948 |
| 4 | 11.1 | -1.00281 | 0.3413 |
| 5 | 17.5 | 1.56438 | 0.4406 |
| Aver | 13.6 | ||
| 2.493391 | 1.1727 |

 Homework Sourse