Table B6 gives data on the number of new business incorporat
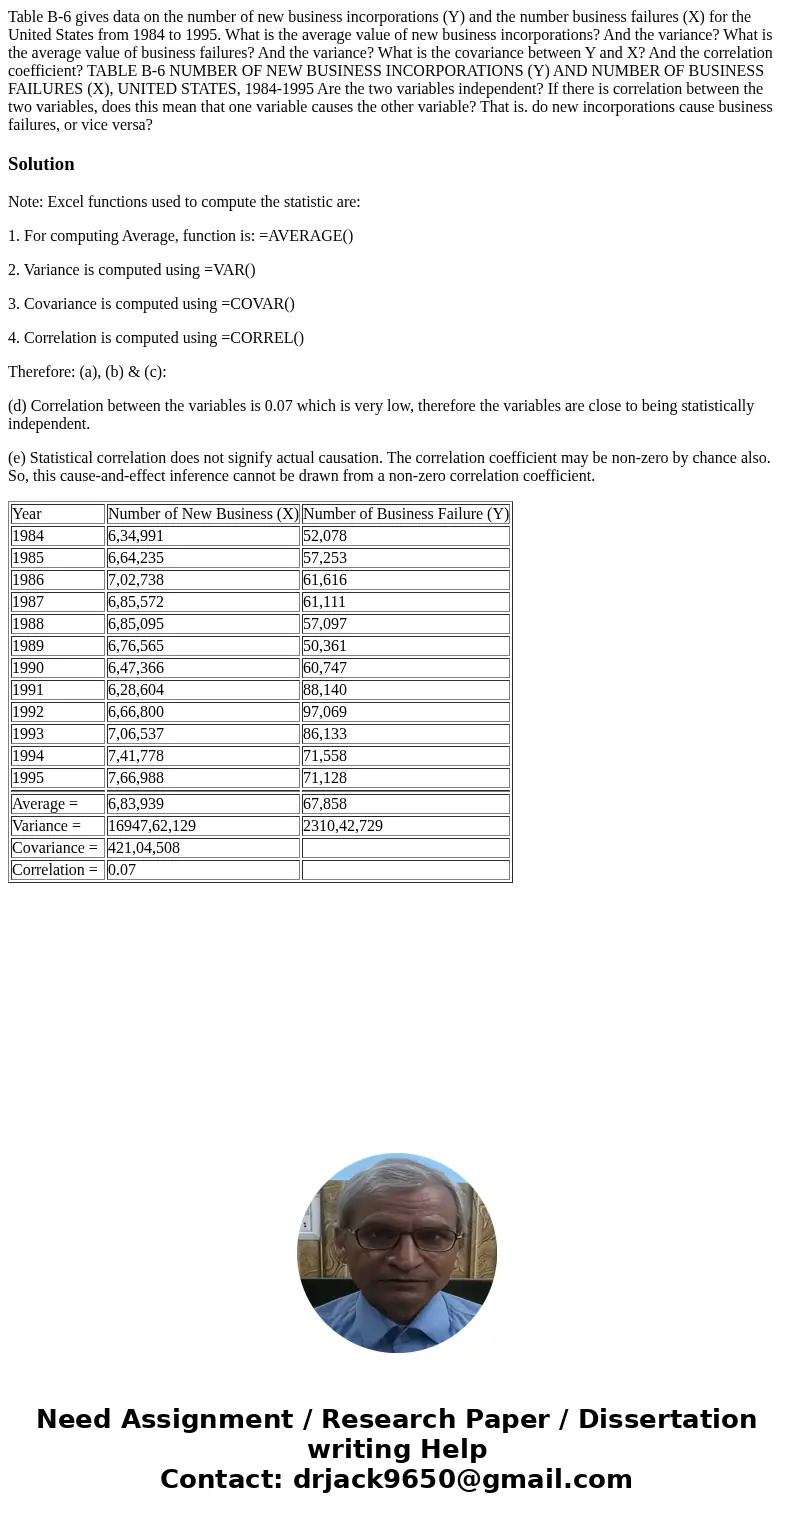
Table B-6 gives data on the number of new business incorporations (Y) and the number business failures (X) for the United States from 1984 to 1995. What is the average value of new business incorporations? And the variance? What is the average value of business failures? And the variance? What is the covariance between Y and X? And the correlation coefficient? TABLE B-6 NUMBER OF NEW BUSINESS INCORPORATIONS (Y) AND NUMBER OF BUSINESS FAILURES (X), UNITED STATES, 1984-1995 Are the two variables independent? If there is correlation between the two variables, does this mean that one variable causes the other variable? That is. do new incorporations cause business failures, or vice versa?

Solution
Note: Excel functions used to compute the statistic are:
1. For computing Average, function is: =AVERAGE()
2. Variance is computed using =VAR()
3. Covariance is computed using =COVAR()
4. Correlation is computed using =CORREL()
Therefore: (a), (b) & (c):
(d) Correlation between the variables is 0.07 which is very low, therefore the variables are close to being statistically independent.
(e) Statistical correlation does not signify actual causation. The correlation coefficient may be non-zero by chance also. So, this cause-and-effect inference cannot be drawn from a non-zero correlation coefficient.
| Year | Number of New Business (X) | Number of Business Failure (Y) |
| 1984 | 6,34,991 | 52,078 |
| 1985 | 6,64,235 | 57,253 |
| 1986 | 7,02,738 | 61,616 |
| 1987 | 6,85,572 | 61,111 |
| 1988 | 6,85,095 | 57,097 |
| 1989 | 6,76,565 | 50,361 |
| 1990 | 6,47,366 | 60,747 |
| 1991 | 6,28,604 | 88,140 |
| 1992 | 6,66,800 | 97,069 |
| 1993 | 7,06,537 | 86,133 |
| 1994 | 7,41,778 | 71,558 |
| 1995 | 7,66,988 | 71,128 |
| Average = | 6,83,939 | 67,858 |
| Variance = | 16947,62,129 | 2310,42,729 |
| Covariance = | 421,04,508 | |
| Correlation = | 0.07 |

 Homework Sourse