7 The measurements in cm made by 21 students of a table with
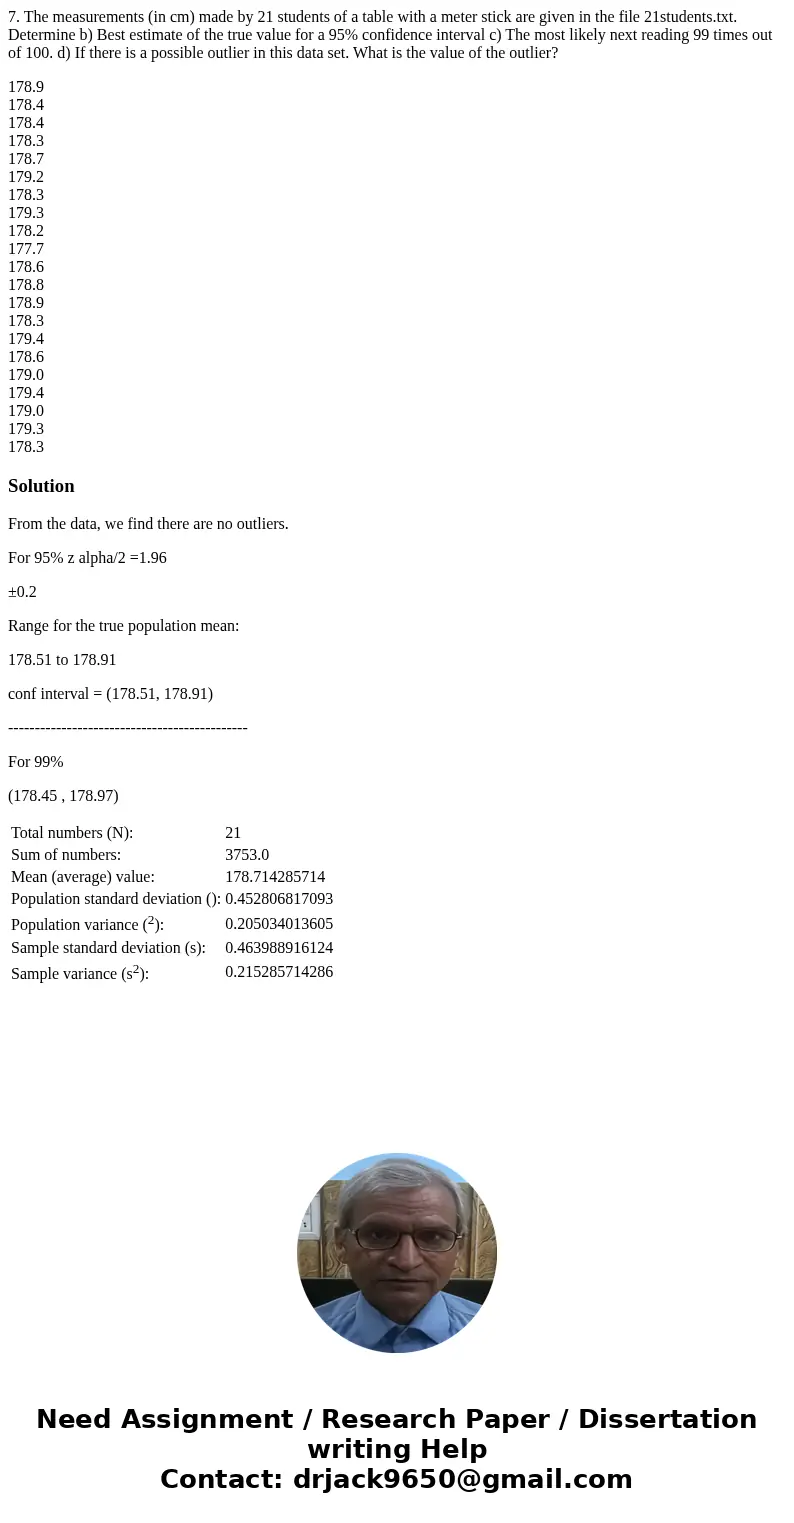
7. The measurements (in cm) made by 21 students of a table with a meter stick are given in the file 21students.txt. Determine b) Best estimate of the true value for a 95% confidence interval c) The most likely next reading 99 times out of 100. d) If there is a possible outlier in this data set. What is the value of the outlier?
178.9
178.4
178.4
178.3
178.7
179.2
178.3
179.3
178.2
177.7
178.6
178.8
178.9
178.3
179.4
178.6
179.0
179.4
179.0
179.3
178.3
Solution
From the data, we find there are no outliers.
For 95% z alpha/2 =1.96
±0.2
Range for the true population mean:
178.51 to 178.91
conf interval = (178.51, 178.91)
---------------------------------------------
For 99%
(178.45 , 178.97)
| Total numbers (N): | 21 |
| Sum of numbers: | 3753.0 |
| Mean (average) value: | 178.714285714 |
| Population standard deviation (): | 0.452806817093 |
| Population variance (2): | 0.205034013605 |
| Sample standard deviation (s): | 0.463988916124 |
| Sample variance (s2): | 0.215285714286 |

 Homework Sourse