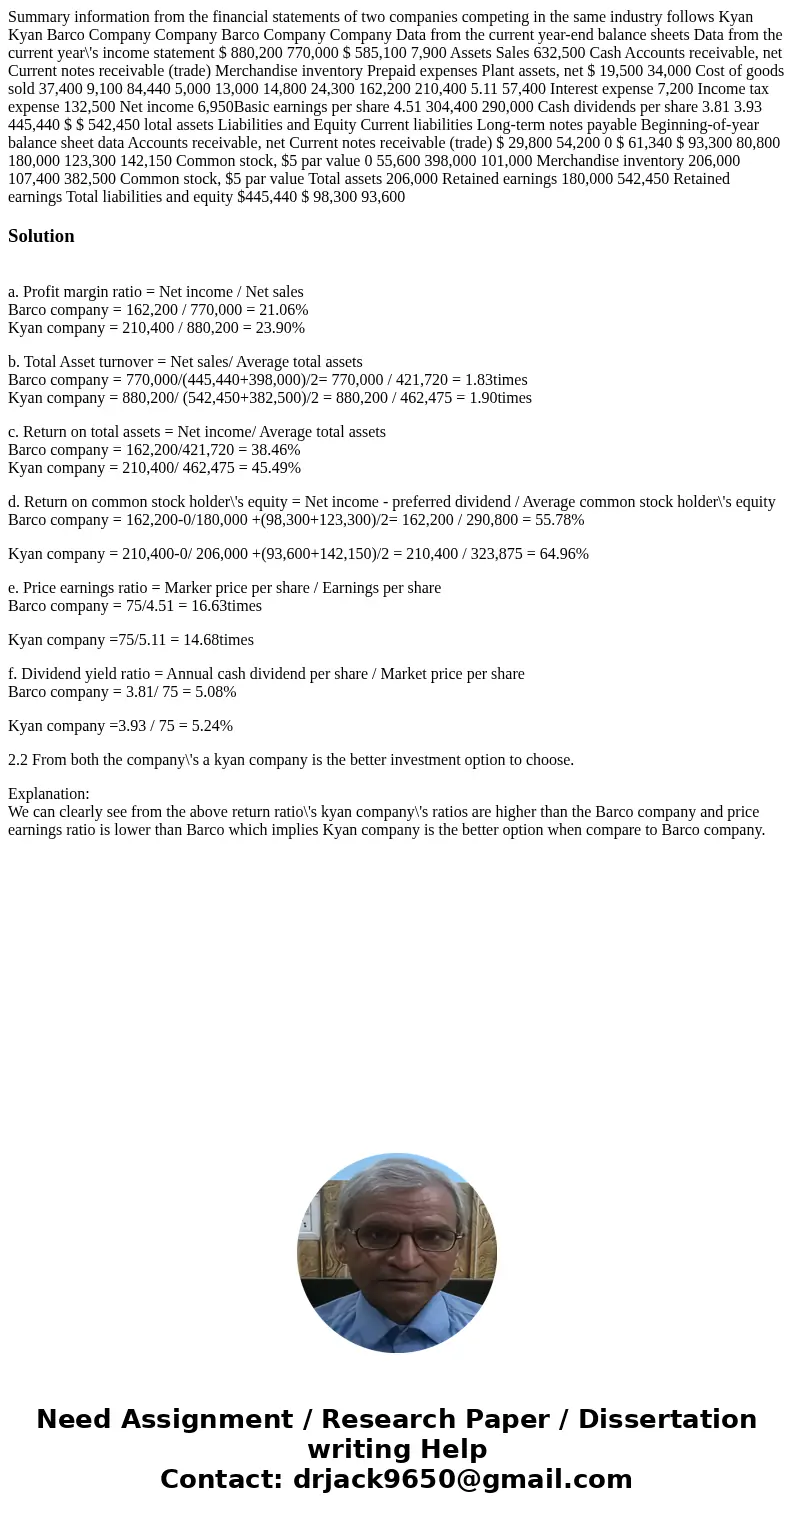
Summary information from the financial statements of two com
Solution
a. Profit margin ratio = Net income / Net sales
Barco company = 162,200 / 770,000 = 21.06%
Kyan company = 210,400 / 880,200 = 23.90%
b. Total Asset turnover = Net sales/ Average total assets
Barco company = 770,000/(445,440+398,000)/2= 770,000 / 421,720 = 1.83times
Kyan company = 880,200/ (542,450+382,500)/2 = 880,200 / 462,475 = 1.90times
c. Return on total assets = Net income/ Average total assets
Barco company = 162,200/421,720 = 38.46%
Kyan company = 210,400/ 462,475 = 45.49%
d. Return on common stock holder\'s equity = Net income - preferred dividend / Average common stock holder\'s equity
Barco company = 162,200-0/180,000 +(98,300+123,300)/2= 162,200 / 290,800 = 55.78%
Kyan company = 210,400-0/ 206,000 +(93,600+142,150)/2 = 210,400 / 323,875 = 64.96%
e. Price earnings ratio = Marker price per share / Earnings per share
Barco company = 75/4.51 = 16.63times
Kyan company =75/5.11 = 14.68times
f. Dividend yield ratio = Annual cash dividend per share / Market price per share
Barco company = 3.81/ 75 = 5.08%
Kyan company =3.93 / 75 = 5.24%
2.2 From both the company\'s a kyan company is the better investment option to choose.
Explanation:
We can clearly see from the above return ratio\'s kyan company\'s ratios are higher than the Barco company and price earnings ratio is lower than Barco which implies Kyan company is the better option when compare to Barco company.

 Homework Sourse