Random samples of female and male drivers are asked to estim
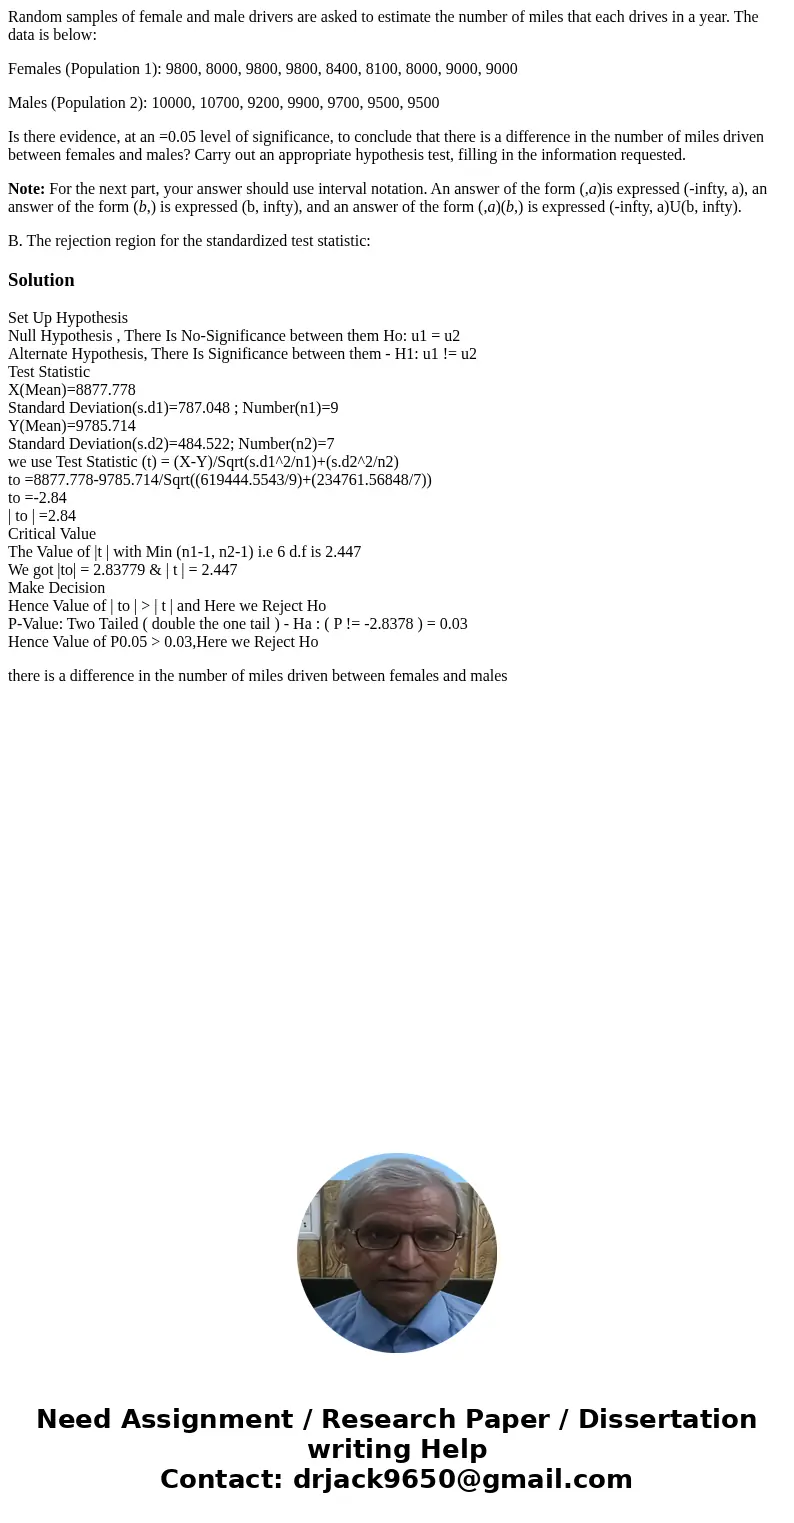
Random samples of female and male drivers are asked to estimate the number of miles that each drives in a year. The data is below:
Females (Population 1): 9800, 8000, 9800, 9800, 8400, 8100, 8000, 9000, 9000
Males (Population 2): 10000, 10700, 9200, 9900, 9700, 9500, 9500
Is there evidence, at an =0.05 level of significance, to conclude that there is a difference in the number of miles driven between females and males? Carry out an appropriate hypothesis test, filling in the information requested.
Note: For the next part, your answer should use interval notation. An answer of the form (,a)is expressed (-infty, a), an answer of the form (b,) is expressed (b, infty), and an answer of the form (,a)(b,) is expressed (-infty, a)U(b, infty).
B. The rejection region for the standardized test statistic:
Solution
Set Up Hypothesis
Null Hypothesis , There Is No-Significance between them Ho: u1 = u2
Alternate Hypothesis, There Is Significance between them - H1: u1 != u2
Test Statistic
X(Mean)=8877.778
Standard Deviation(s.d1)=787.048 ; Number(n1)=9
Y(Mean)=9785.714
Standard Deviation(s.d2)=484.522; Number(n2)=7
we use Test Statistic (t) = (X-Y)/Sqrt(s.d1^2/n1)+(s.d2^2/n2)
to =8877.778-9785.714/Sqrt((619444.5543/9)+(234761.56848/7))
to =-2.84
| to | =2.84
Critical Value
The Value of |t | with Min (n1-1, n2-1) i.e 6 d.f is 2.447
We got |to| = 2.83779 & | t | = 2.447
Make Decision
Hence Value of | to | > | t | and Here we Reject Ho
P-Value: Two Tailed ( double the one tail ) - Ha : ( P != -2.8378 ) = 0.03
Hence Value of P0.05 > 0.03,Here we Reject Ho
there is a difference in the number of miles driven between females and males

 Homework Sourse