Can someone please help me with this problem on matlab progr
Can someone please help me with this problem on matlab program, the problem is in the second picture asking to use the data in the first picture to create 2 figures?
http://www.chegg.com/homework-help/Thinking-Like-an-Engineer-3rd-edition-chapter-19-problem-13RQ-solution-9780133595123
I added the link of the problem. I just need to create the two figures describe in the image 2. Can someone help ? Thank you
Solution
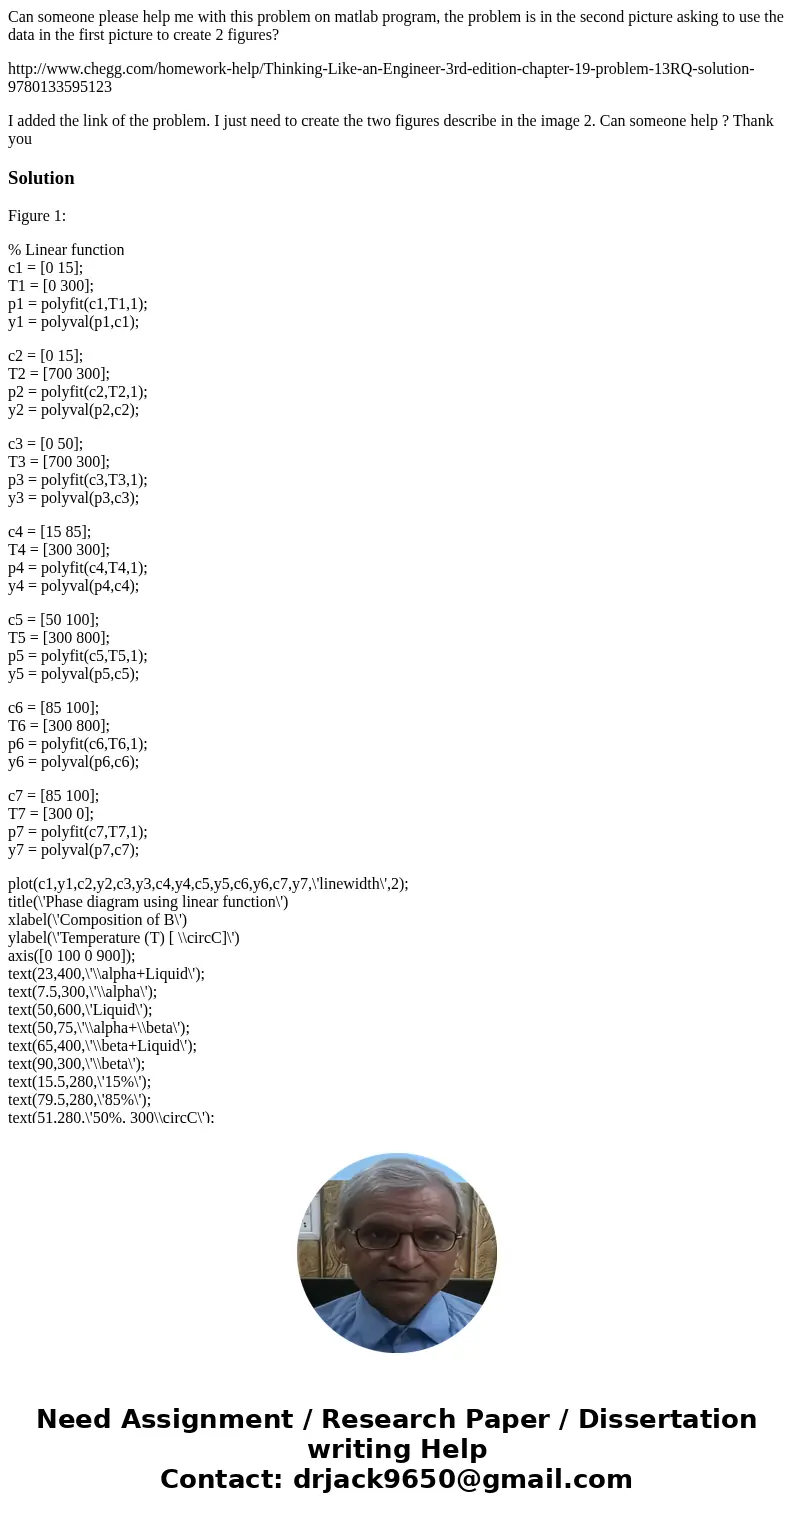
Figure 1:
% Linear function
c1 = [0 15];
T1 = [0 300];
p1 = polyfit(c1,T1,1);
y1 = polyval(p1,c1);
c2 = [0 15];
T2 = [700 300];
p2 = polyfit(c2,T2,1);
y2 = polyval(p2,c2);
c3 = [0 50];
T3 = [700 300];
p3 = polyfit(c3,T3,1);
y3 = polyval(p3,c3);
c4 = [15 85];
T4 = [300 300];
p4 = polyfit(c4,T4,1);
y4 = polyval(p4,c4);
c5 = [50 100];
T5 = [300 800];
p5 = polyfit(c5,T5,1);
y5 = polyval(p5,c5);
c6 = [85 100];
T6 = [300 800];
p6 = polyfit(c6,T6,1);
y6 = polyval(p6,c6);
c7 = [85 100];
T7 = [300 0];
p7 = polyfit(c7,T7,1);
y7 = polyval(p7,c7);
plot(c1,y1,c2,y2,c3,y3,c4,y4,c5,y5,c6,y6,c7,y7,\'linewidth\',2);
title(\'Phase diagram using linear function\')
xlabel(\'Composition of B\')
ylabel(\'Temperature (T) [ \\circC]\')
axis([0 100 0 900]);
text(23,400,\'\\alpha+Liquid\');
text(7.5,300,\'\\alpha\');
text(50,600,\'Liquid\');
text(50,75,\'\\alpha+\\beta\');
text(65,400,\'\\beta+Liquid\');
text(90,300,\'\\beta\');
text(15.5,280,\'15%\');
text(79.5,280,\'85%\');
text(51,280,\'50%, 300\\circC\');
text(1,710,\'700\\circC\');
text(90,800,\'800\\circC\');
text(49,240,\'\\uparrow Eutectic point\')
text(25,270,\'\\uparrow Eutectic line\')
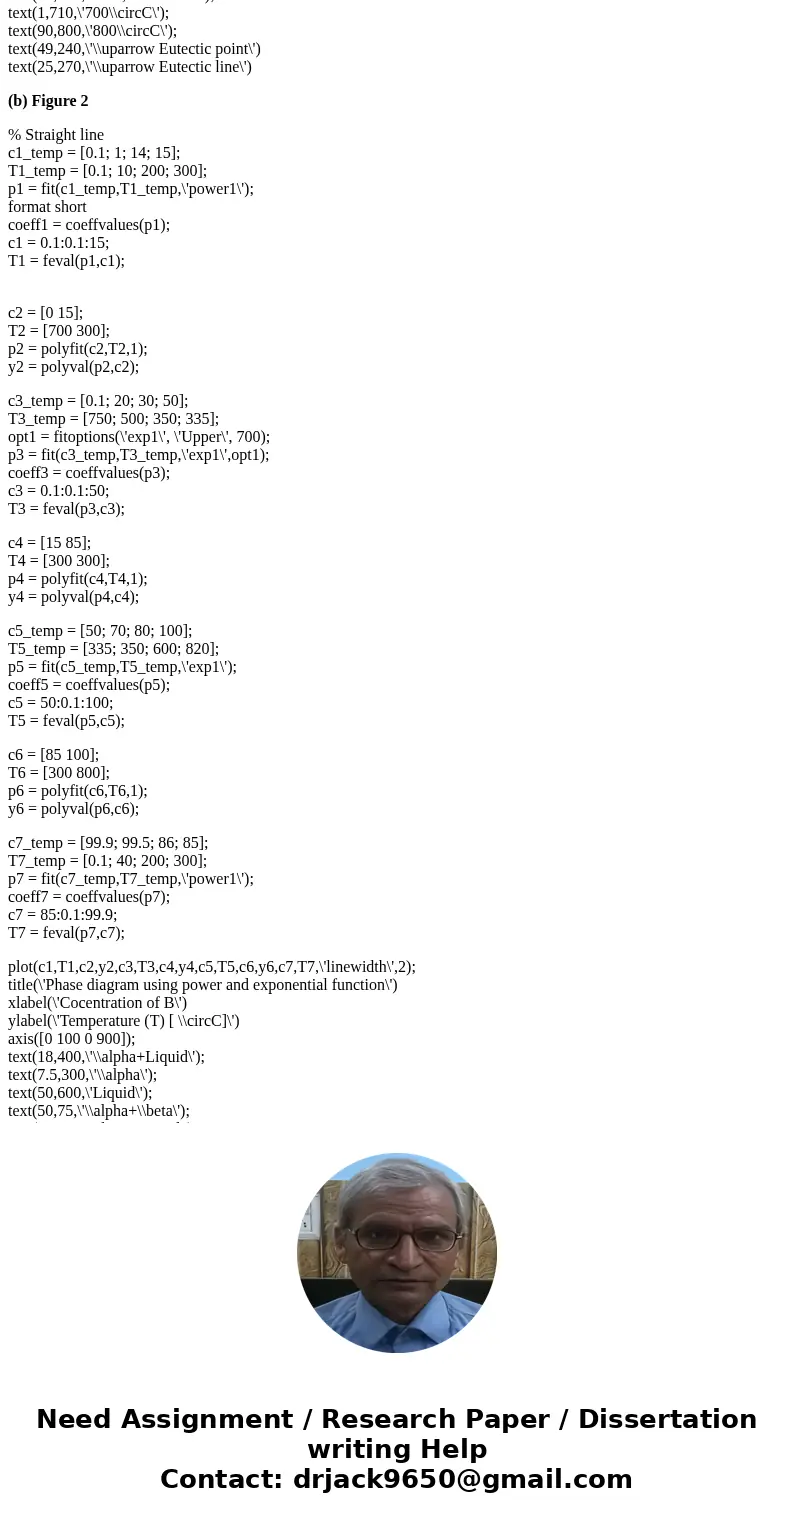
(b) Figure 2
% Straight line
c1_temp = [0.1; 1; 14; 15];
T1_temp = [0.1; 10; 200; 300];
p1 = fit(c1_temp,T1_temp,\'power1\');
format short
coeff1 = coeffvalues(p1);
c1 = 0.1:0.1:15;
T1 = feval(p1,c1);
c2 = [0 15];
T2 = [700 300];
p2 = polyfit(c2,T2,1);
y2 = polyval(p2,c2);
c3_temp = [0.1; 20; 30; 50];
T3_temp = [750; 500; 350; 335];
opt1 = fitoptions(\'exp1\', \'Upper\', 700);
p3 = fit(c3_temp,T3_temp,\'exp1\',opt1);
coeff3 = coeffvalues(p3);
c3 = 0.1:0.1:50;
T3 = feval(p3,c3);
c4 = [15 85];
T4 = [300 300];
p4 = polyfit(c4,T4,1);
y4 = polyval(p4,c4);
c5_temp = [50; 70; 80; 100];
T5_temp = [335; 350; 600; 820];
p5 = fit(c5_temp,T5_temp,\'exp1\');
coeff5 = coeffvalues(p5);
c5 = 50:0.1:100;
T5 = feval(p5,c5);
c6 = [85 100];
T6 = [300 800];
p6 = polyfit(c6,T6,1);
y6 = polyval(p6,c6);
c7_temp = [99.9; 99.5; 86; 85];
T7_temp = [0.1; 40; 200; 300];
p7 = fit(c7_temp,T7_temp,\'power1\');
coeff7 = coeffvalues(p7);
c7 = 85:0.1:99.9;
T7 = feval(p7,c7);
plot(c1,T1,c2,y2,c3,T3,c4,y4,c5,T5,c6,y6,c7,T7,\'linewidth\',2);
title(\'Phase diagram using power and exponential function\')
xlabel(\'Cocentration of B\')
ylabel(\'Temperature (T) [ \\circC]\')
axis([0 100 0 900]);
text(18,400,\'\\alpha+Liquid\');
text(7.5,300,\'\\alpha\');
text(50,600,\'Liquid\');
text(50,75,\'\\alpha+\\beta\');
text(68,400,\'\\beta+Liquid\');
text(90,300,\'\\beta\');
text(15.5,280,\'15%\');
text(79,280,\'85%\');
text(51,280,\'50%, 300\\circC\');
text(1,710,\'700\\circC\');
text(90,800,\'800\\circC\');
text(49,240,\'\\uparrow Eutectic point\')
text(25,270,\'\\uparrow Eutectic line\')
text(15,150,[ num2str(coeff1(1),\'%.5f\'),\'(concB)pow(\' num2str(coeff1(2),\'%.2f\') \') \' ])
text(25,500,[ num2str(coeff3(1),\'%.1f\'),\'exp(\' num2str(coeff3(2),\'%.2f\') \' concB) \' ])
text(58,650,[ num2str(coeff5(1),\'%.1f\'),\'exp(\' num2str(coeff5(2),\'%.2f\') \' concB) \' ])
text(60,100,[ num2str(coeff7(1),\'%e\'),\'(concB)pow(\' num2str(coeff1(2),\'%.2f\') \') \' ])


 Homework Sourse