Sample data Calculations X Y 563 773 591 671 640 632 710 605
Sample data
Calculations
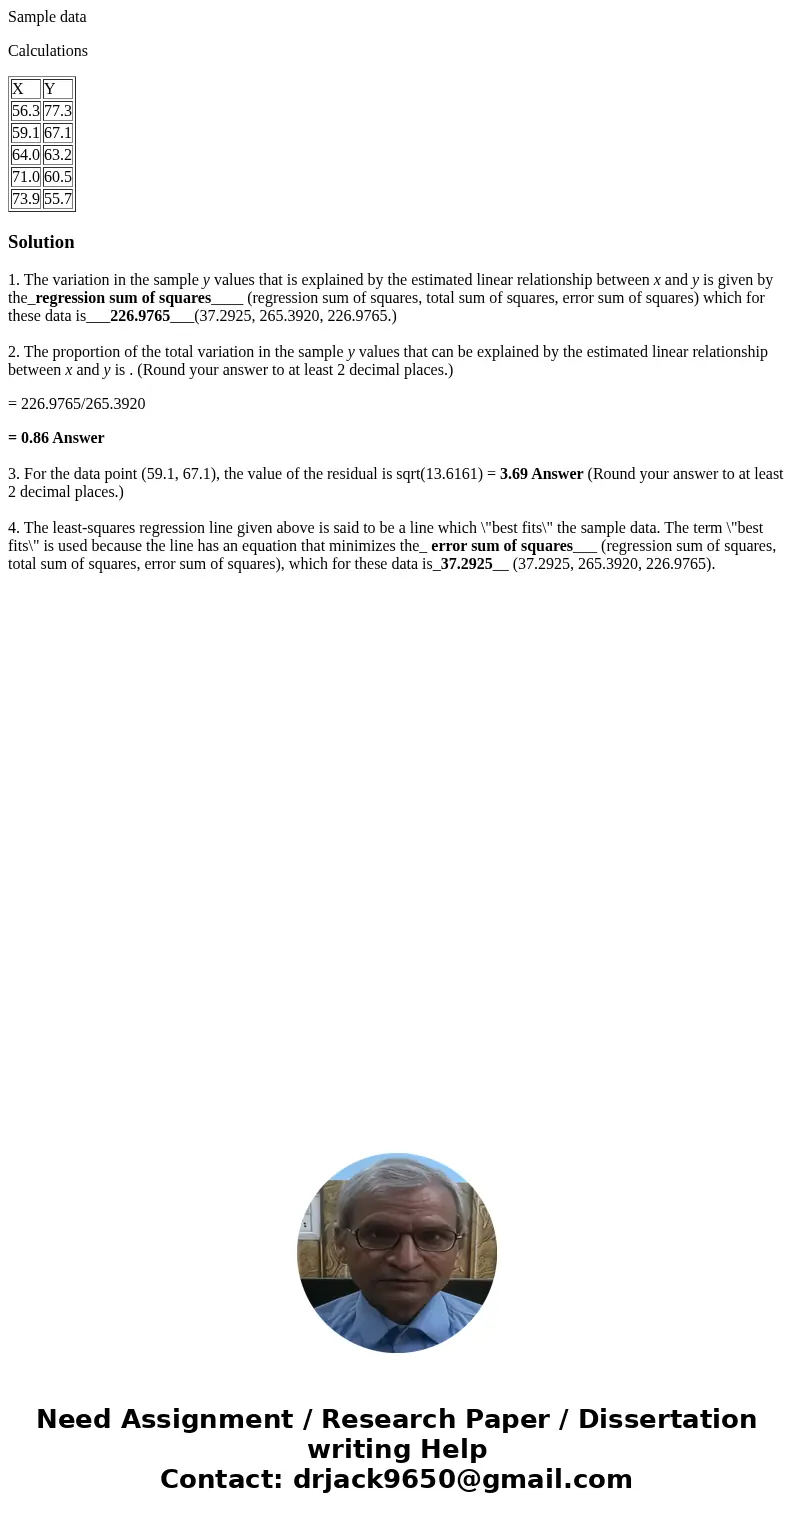
| X | Y |
| 56.3 | 77.3 |
| 59.1 | 67.1 |
| 64.0 | 63.2 |
| 71.0 | 60.5 |
| 73.9 | 55.7 |
Solution
1. The variation in the sample y values that is explained by the estimated linear relationship between x and y is given by the_regression sum of squares____ (regression sum of squares, total sum of squares, error sum of squares) which for these data is___226.9765___(37.2925, 265.3920, 226.9765.)
2. The proportion of the total variation in the sample y values that can be explained by the estimated linear relationship between x and y is . (Round your answer to at least 2 decimal places.)
= 226.9765/265.3920
= 0.86 Answer
3. For the data point (59.1, 67.1), the value of the residual is sqrt(13.6161) = 3.69 Answer (Round your answer to at least 2 decimal places.)
4. The least-squares regression line given above is said to be a line which \"best fits\" the sample data. The term \"best fits\" is used because the line has an equation that minimizes the_ error sum of squares___ (regression sum of squares, total sum of squares, error sum of squares), which for these data is_37.2925__ (37.2925, 265.3920, 226.9765).

 Homework Sourse