The manager of a discount store would like to determine whet
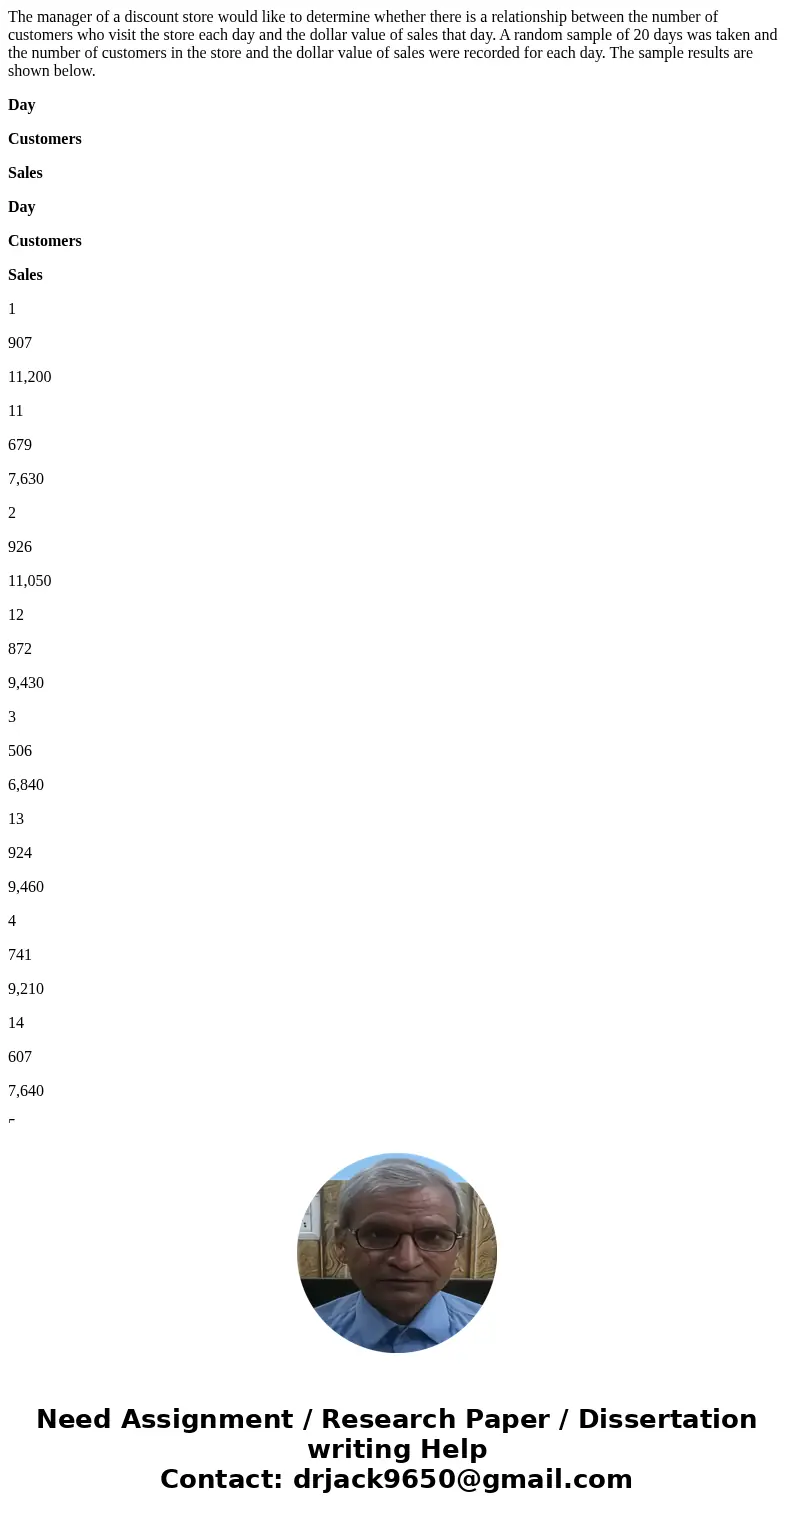
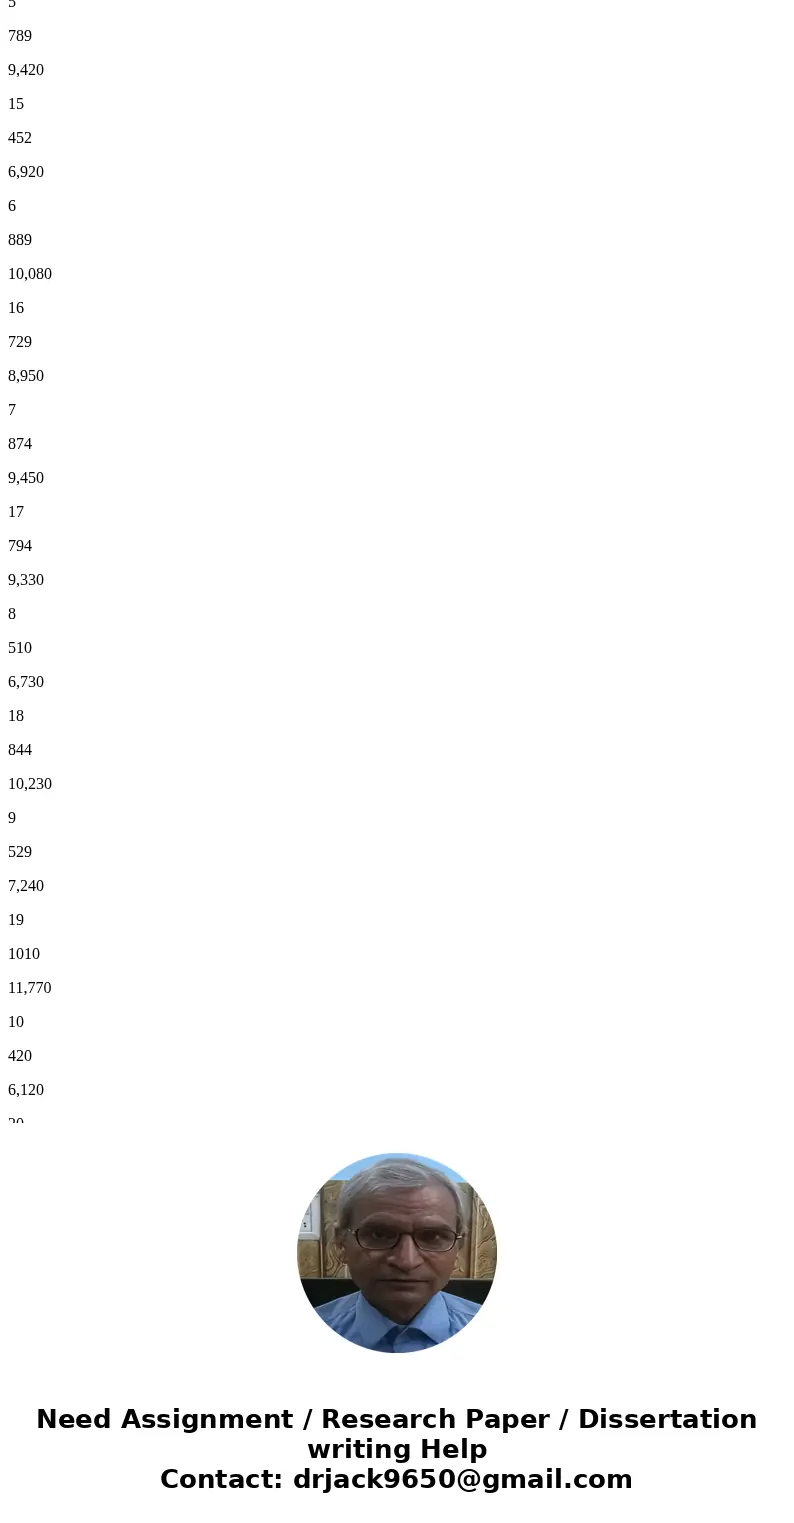
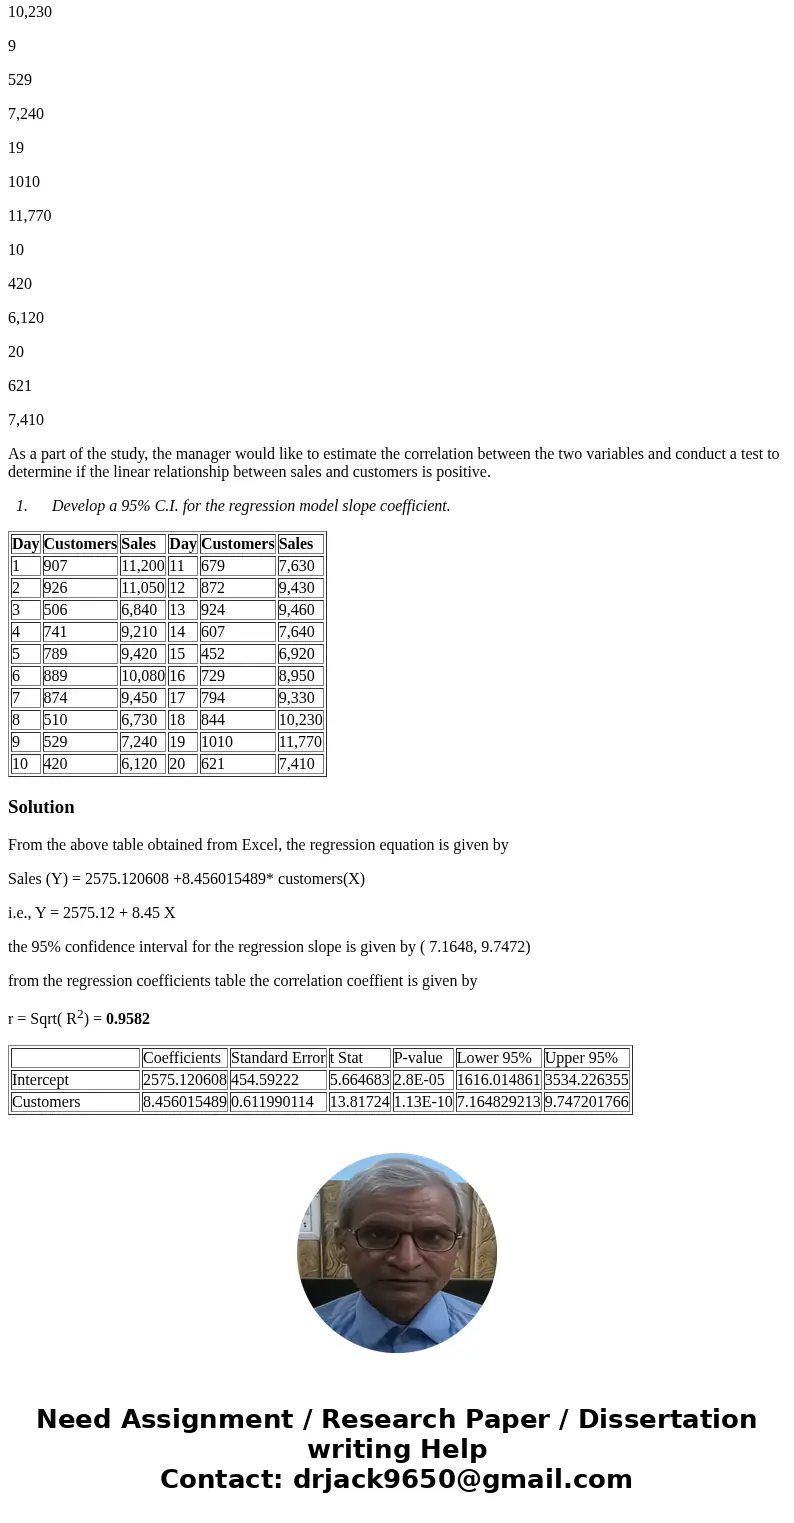
The manager of a discount store would like to determine whether there is a relationship between the number of customers who visit the store each day and the dollar value of sales that day. A random sample of 20 days was taken and the number of customers in the store and the dollar value of sales were recorded for each day. The sample results are shown below.
Day
Customers
Sales
Day
Customers
Sales
1
907
11,200
11
679
7,630
2
926
11,050
12
872
9,430
3
506
6,840
13
924
9,460
4
741
9,210
14
607
7,640
5
789
9,420
15
452
6,920
6
889
10,080
16
729
8,950
7
874
9,450
17
794
9,330
8
510
6,730
18
844
10,230
9
529
7,240
19
1010
11,770
10
420
6,120
20
621
7,410
As a part of the study, the manager would like to estimate the correlation between the two variables and conduct a test to determine if the linear relationship between sales and customers is positive.
1. Develop a 95% C.I. for the regression model slope coefficient.
| Day | Customers | Sales | Day | Customers | Sales |
| 1 | 907 | 11,200 | 11 | 679 | 7,630 |
| 2 | 926 | 11,050 | 12 | 872 | 9,430 |
| 3 | 506 | 6,840 | 13 | 924 | 9,460 |
| 4 | 741 | 9,210 | 14 | 607 | 7,640 |
| 5 | 789 | 9,420 | 15 | 452 | 6,920 |
| 6 | 889 | 10,080 | 16 | 729 | 8,950 |
| 7 | 874 | 9,450 | 17 | 794 | 9,330 |
| 8 | 510 | 6,730 | 18 | 844 | 10,230 |
| 9 | 529 | 7,240 | 19 | 1010 | 11,770 |
| 10 | 420 | 6,120 | 20 | 621 | 7,410 |
Solution
From the above table obtained from Excel, the regression equation is given by
Sales (Y) = 2575.120608 +8.456015489* customers(X)
i.e., Y = 2575.12 + 8.45 X
the 95% confidence interval for the regression slope is given by ( 7.1648, 9.7472)
from the regression coefficients table the correlation coeffient is given by
r = Sqrt( R2) = 0.9582
| Coefficients | Standard Error | t Stat | P-value | Lower 95% | Upper 95% | |
| Intercept | 2575.120608 | 454.59222 | 5.664683 | 2.8E-05 | 1616.014861 | 3534.226355 |
| Customers | 8.456015489 | 0.611990114 | 13.81724 | 1.13E-10 | 7.164829213 | 9.747201766 |


 Homework Sourse