Presented below are the financial statements of Warner Compa
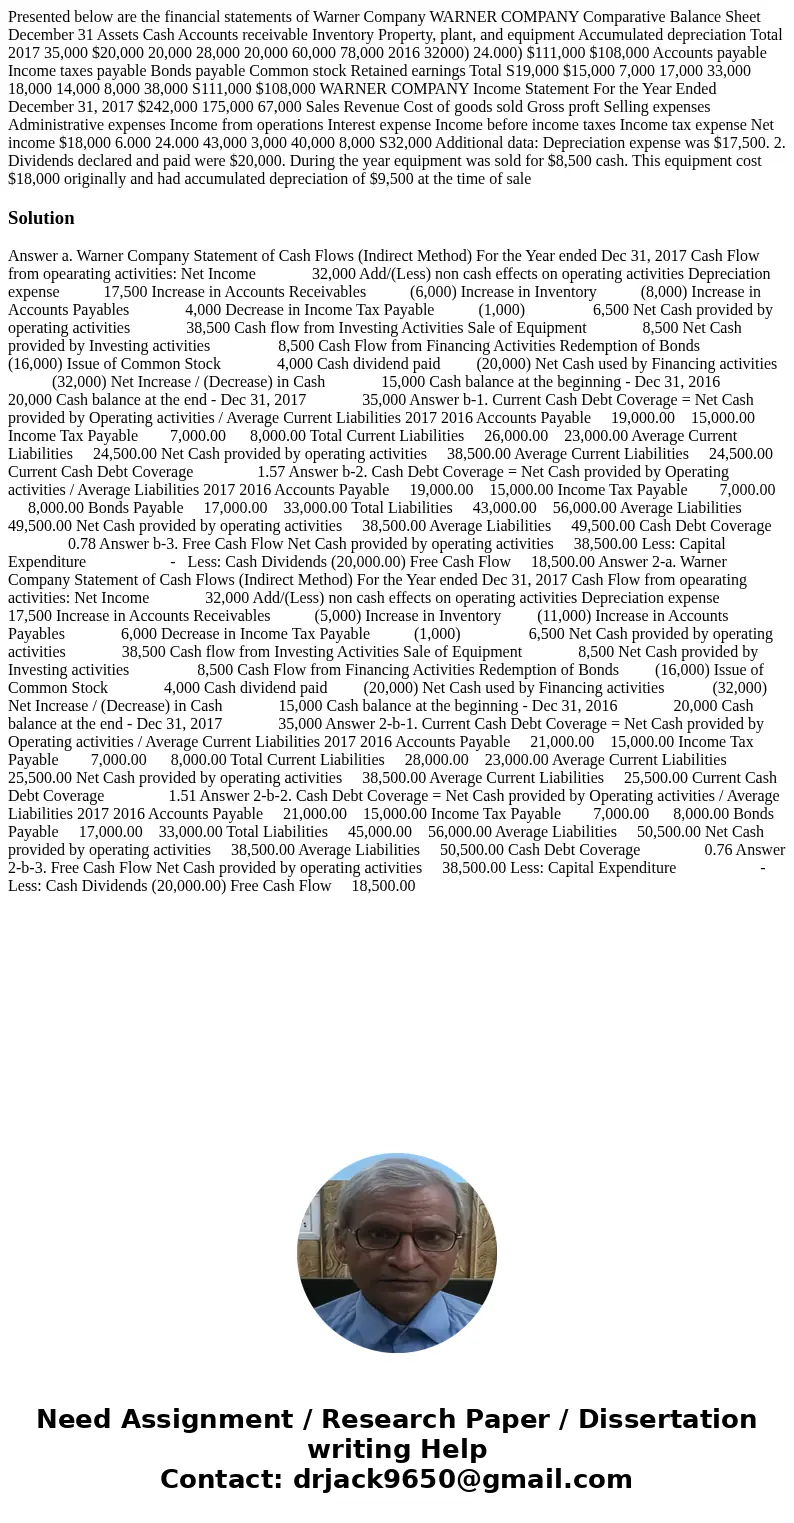
Presented below are the financial statements of Warner Company WARNER COMPANY Comparative Balance Sheet December 31 Assets Cash Accounts receivable Inventory Property, plant, and equipment Accumulated depreciation Total 2017 35,000 $20,000 20,000 28,000 20,000 60,000 78,000 2016 32000) 24.000) $111,000 $108,000 Accounts payable Income taxes payable Bonds payable Common stock Retained earnings Total S19,000 $15,000 7,000 17,000 33,000 18,000 14,000 8,000 38,000 S111,000 $108,000 WARNER COMPANY Income Statement For the Year Ended December 31, 2017 $242,000 175,000 67,000 Sales Revenue Cost of goods sold Gross proft Selling expenses Administrative expenses Income from operations Interest expense Income before income taxes Income tax expense Net income $18,000 6.000 24.000 43,000 3,000 40,000 8,000 S32,000 Additional data: Depreciation expense was $17,500. 2. Dividends declared and paid were $20,000. During the year equipment was sold for $8,500 cash. This equipment cost $18,000 originally and had accumulated depreciation of $9,500 at the time of sale 
Solution
Answer a. Warner Company Statement of Cash Flows (Indirect Method) For the Year ended Dec 31, 2017 Cash Flow from opearating activities: Net Income 32,000 Add/(Less) non cash effects on operating activities Depreciation expense 17,500 Increase in Accounts Receivables (6,000) Increase in Inventory (8,000) Increase in Accounts Payables 4,000 Decrease in Income Tax Payable (1,000) 6,500 Net Cash provided by operating activities 38,500 Cash flow from Investing Activities Sale of Equipment 8,500 Net Cash provided by Investing activities 8,500 Cash Flow from Financing Activities Redemption of Bonds (16,000) Issue of Common Stock 4,000 Cash dividend paid (20,000) Net Cash used by Financing activities (32,000) Net Increase / (Decrease) in Cash 15,000 Cash balance at the beginning - Dec 31, 2016 20,000 Cash balance at the end - Dec 31, 2017 35,000 Answer b-1. Current Cash Debt Coverage = Net Cash provided by Operating activities / Average Current Liabilities 2017 2016 Accounts Payable 19,000.00 15,000.00 Income Tax Payable 7,000.00 8,000.00 Total Current Liabilities 26,000.00 23,000.00 Average Current Liabilities 24,500.00 Net Cash provided by operating activities 38,500.00 Average Current Liabilities 24,500.00 Current Cash Debt Coverage 1.57 Answer b-2. Cash Debt Coverage = Net Cash provided by Operating activities / Average Liabilities 2017 2016 Accounts Payable 19,000.00 15,000.00 Income Tax Payable 7,000.00 8,000.00 Bonds Payable 17,000.00 33,000.00 Total Liabilities 43,000.00 56,000.00 Average Liabilities 49,500.00 Net Cash provided by operating activities 38,500.00 Average Liabilities 49,500.00 Cash Debt Coverage 0.78 Answer b-3. Free Cash Flow Net Cash provided by operating activities 38,500.00 Less: Capital Expenditure - Less: Cash Dividends (20,000.00) Free Cash Flow 18,500.00 Answer 2-a. Warner Company Statement of Cash Flows (Indirect Method) For the Year ended Dec 31, 2017 Cash Flow from opearating activities: Net Income 32,000 Add/(Less) non cash effects on operating activities Depreciation expense 17,500 Increase in Accounts Receivables (5,000) Increase in Inventory (11,000) Increase in Accounts Payables 6,000 Decrease in Income Tax Payable (1,000) 6,500 Net Cash provided by operating activities 38,500 Cash flow from Investing Activities Sale of Equipment 8,500 Net Cash provided by Investing activities 8,500 Cash Flow from Financing Activities Redemption of Bonds (16,000) Issue of Common Stock 4,000 Cash dividend paid (20,000) Net Cash used by Financing activities (32,000) Net Increase / (Decrease) in Cash 15,000 Cash balance at the beginning - Dec 31, 2016 20,000 Cash balance at the end - Dec 31, 2017 35,000 Answer 2-b-1. Current Cash Debt Coverage = Net Cash provided by Operating activities / Average Current Liabilities 2017 2016 Accounts Payable 21,000.00 15,000.00 Income Tax Payable 7,000.00 8,000.00 Total Current Liabilities 28,000.00 23,000.00 Average Current Liabilities 25,500.00 Net Cash provided by operating activities 38,500.00 Average Current Liabilities 25,500.00 Current Cash Debt Coverage 1.51 Answer 2-b-2. Cash Debt Coverage = Net Cash provided by Operating activities / Average Liabilities 2017 2016 Accounts Payable 21,000.00 15,000.00 Income Tax Payable 7,000.00 8,000.00 Bonds Payable 17,000.00 33,000.00 Total Liabilities 45,000.00 56,000.00 Average Liabilities 50,500.00 Net Cash provided by operating activities 38,500.00 Average Liabilities 50,500.00 Cash Debt Coverage 0.76 Answer 2-b-3. Free Cash Flow Net Cash provided by operating activities 38,500.00 Less: Capital Expenditure - Less: Cash Dividends (20,000.00) Free Cash Flow 18,500.00
 Homework Sourse