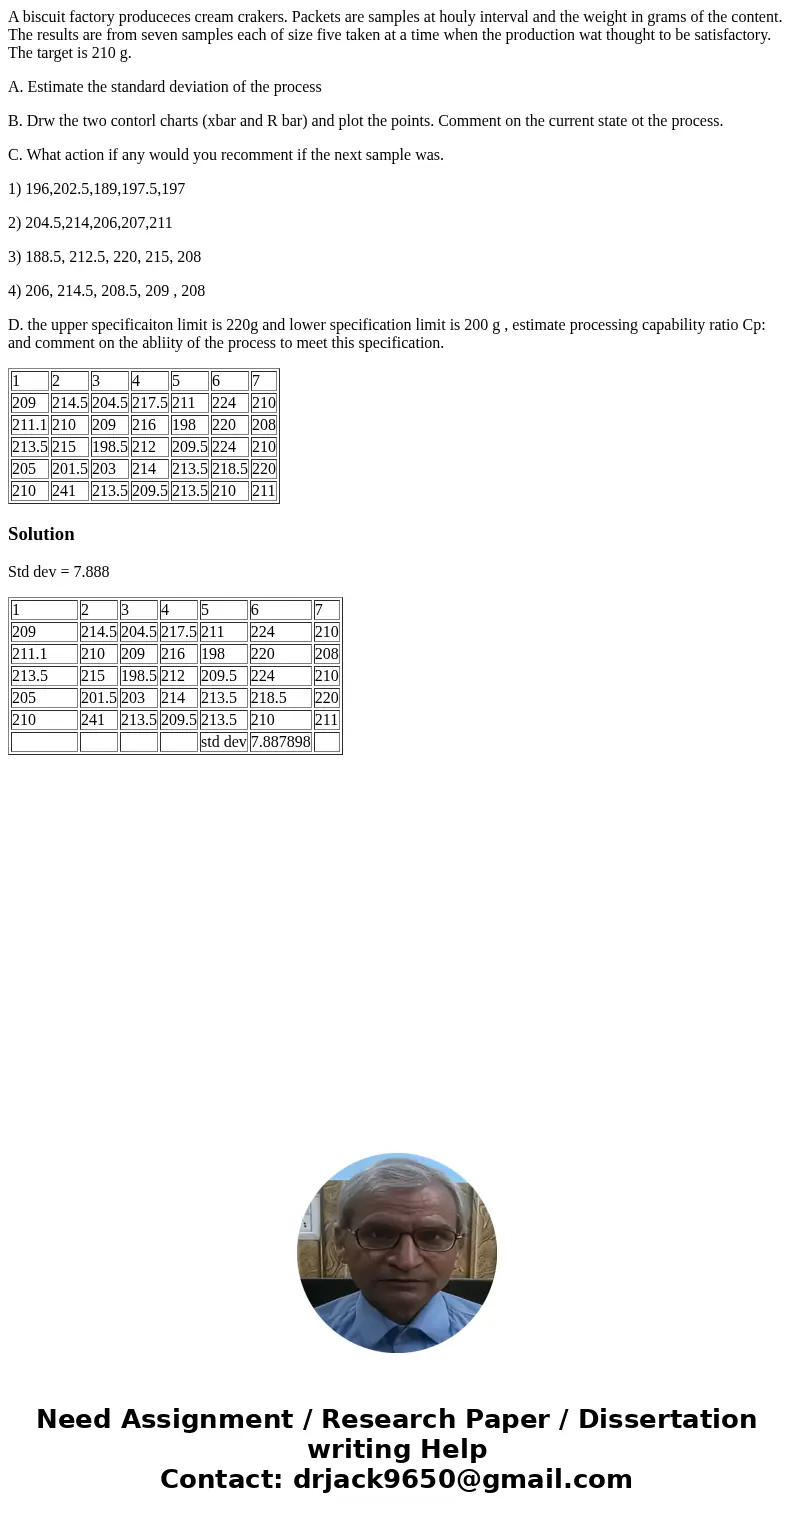
A biscuit factory produceces cream crakers Packets are sampl
A biscuit factory produceces cream crakers. Packets are samples at houly interval and the weight in grams of the content. The results are from seven samples each of size five taken at a time when the production wat thought to be satisfactory. The target is 210 g.
A. Estimate the standard deviation of the process
B. Drw the two contorl charts (xbar and R bar) and plot the points. Comment on the current state ot the process.
C. What action if any would you recomment if the next sample was.
1) 196,202.5,189,197.5,197
2) 204.5,214,206,207,211
3) 188.5, 212.5, 220, 215, 208
4) 206, 214.5, 208.5, 209 , 208
D. the upper specificaiton limit is 220g and lower specification limit is 200 g , estimate processing capability ratio Cp: and comment on the abliity of the process to meet this specification.
| 1 | 2 | 3 | 4 | 5 | 6 | 7 |
| 209 | 214.5 | 204.5 | 217.5 | 211 | 224 | 210 |
| 211.1 | 210 | 209 | 216 | 198 | 220 | 208 |
| 213.5 | 215 | 198.5 | 212 | 209.5 | 224 | 210 |
| 205 | 201.5 | 203 | 214 | 213.5 | 218.5 | 220 |
| 210 | 241 | 213.5 | 209.5 | 213.5 | 210 | 211 |
Solution
Std dev = 7.888
| 1 | 2 | 3 | 4 | 5 | 6 | 7 |
| 209 | 214.5 | 204.5 | 217.5 | 211 | 224 | 210 |
| 211.1 | 210 | 209 | 216 | 198 | 220 | 208 |
| 213.5 | 215 | 198.5 | 212 | 209.5 | 224 | 210 |
| 205 | 201.5 | 203 | 214 | 213.5 | 218.5 | 220 |
| 210 | 241 | 213.5 | 209.5 | 213.5 | 210 | 211 |
| std dev | 7.887898 |

 Homework Sourse