5 The US Bureau of Labor Statistics reports that the average

5.

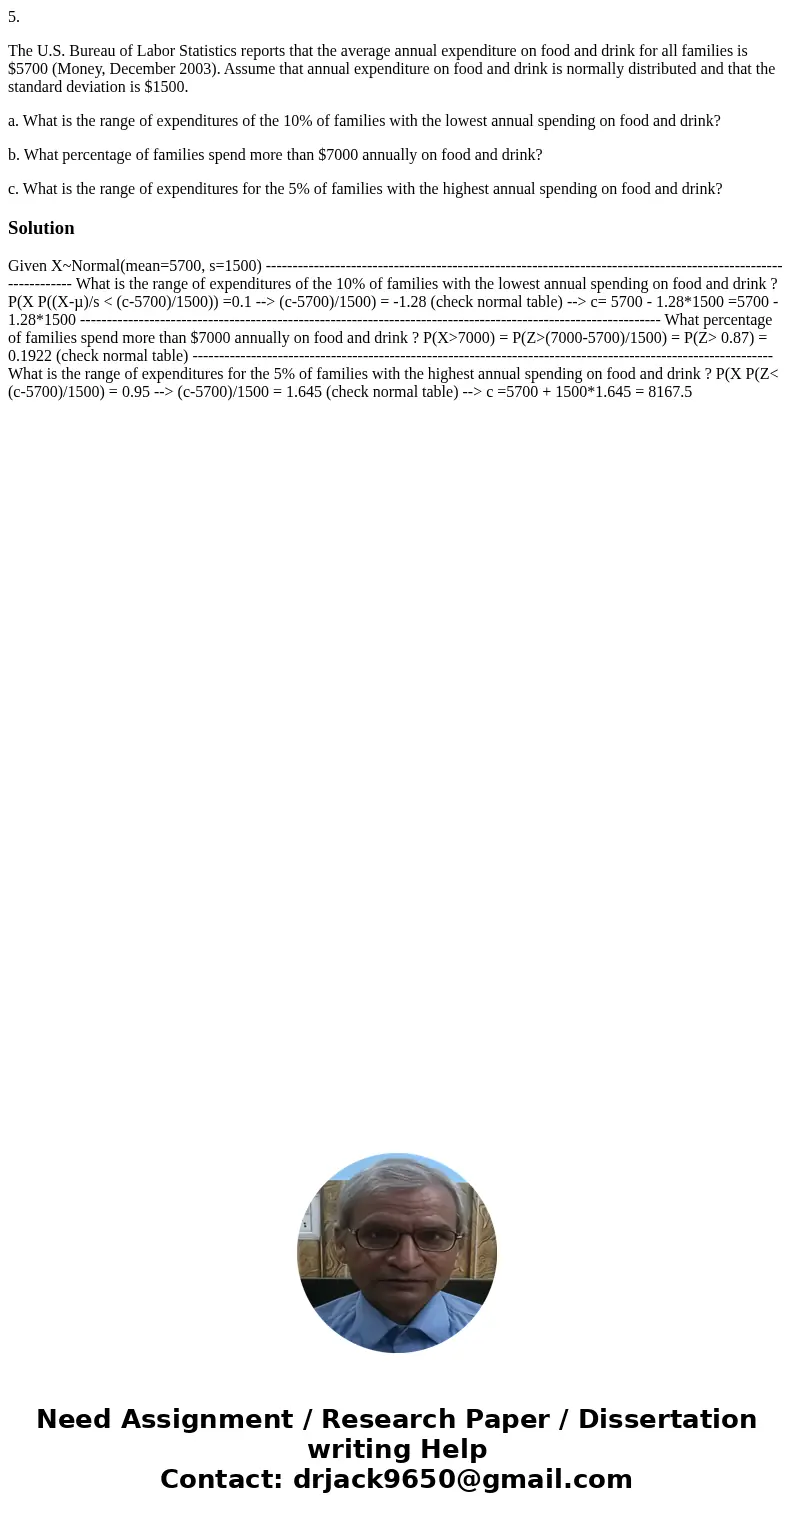
The U.S. Bureau of Labor Statistics reports that the average annual expenditure on food and drink for all families is $5700 (Money, December 2003). Assume that annual expenditure on food and drink is normally distributed and that the standard deviation is $1500.

a. What is the range of expenditures of the 10% of families with the lowest annual spending on food and drink?

b. What percentage of families spend more than $7000 annually on food and drink?

c. What is the range of expenditures for the 5% of families with the highest annual spending on food and drink?

Solution

Given X~Normal(mean=5700, s=1500) ------------------------------------------------------------------------------------------------------------- What is the range of expenditures of the 10% of families with the lowest annual spending on food and drink ? P(X P((X-µ)/s < (c-5700)/1500)) =0.1 --> (c-5700)/1500) = -1.28 (check normal table) --> c= 5700 - 1.28*1500 =5700 - 1.28*1500 ------------------------------------------------------------------------------------------------------------- What percentage of families spend more than $7000 annually on food and drink ? P(X>7000) = P(Z>(7000-5700)/1500) = P(Z> 0.87) = 0.1922 (check normal table) ------------------------------------------------------------------------------------------------------------- What is the range of expenditures for the 5% of families with the highest annual spending on food and drink ? P(X P(Z< (c-5700)/1500) = 0.95 --> (c-5700)/1500 = 1.645 (check normal table) --> c =5700 + 1500*1.645 = 8167.5
5. The U.S. Bureau of Labor Statistics reports that the average annual expenditure on food and drink for all families is $5700 (Money, December 2003). Assume th

Get Help Now

Submit a Take Down Notice

Tutor
Tutor: Dr Jack
Most rated tutor on our site