Table 1 Effects of Vitamin A supplementation on serumretinol

Table 1

Effects of Vitamin A supplementation on serum-retinol levels

                                                      Year 0                         Year 3

Retinol                  N                         Mean+-sd                   Mean+-sd

Vitamin A group   73                       1.89+-0.36                  2.06+-0.53

Trace group          57                       1.83+-0.31                  1.78+-0.30

One assumption of a test in this problem is that the distribution of serum retinol is approximately normal. To verify this assumption, the investigators obtained a frequency distribution of serum retinol at year 0 among males in the vitamin A group, with data as shown in Table 2 below.

Table 2

Distribution of serum retinol in a retinitis-pigmentosa population

Serum-retinol group                                                 n

<=1.40                                                                     6

1.41-1.75                                                                 22

1.76-2.10                                                                 22

2.11-2.45                                                                 20

>=2.46                                                                      3

                                                            Total     73

1. Perform a statistical test to check on the normality assumption. Given your results, do you feel the assumption of normality is warranted? Why or why not?

Solution
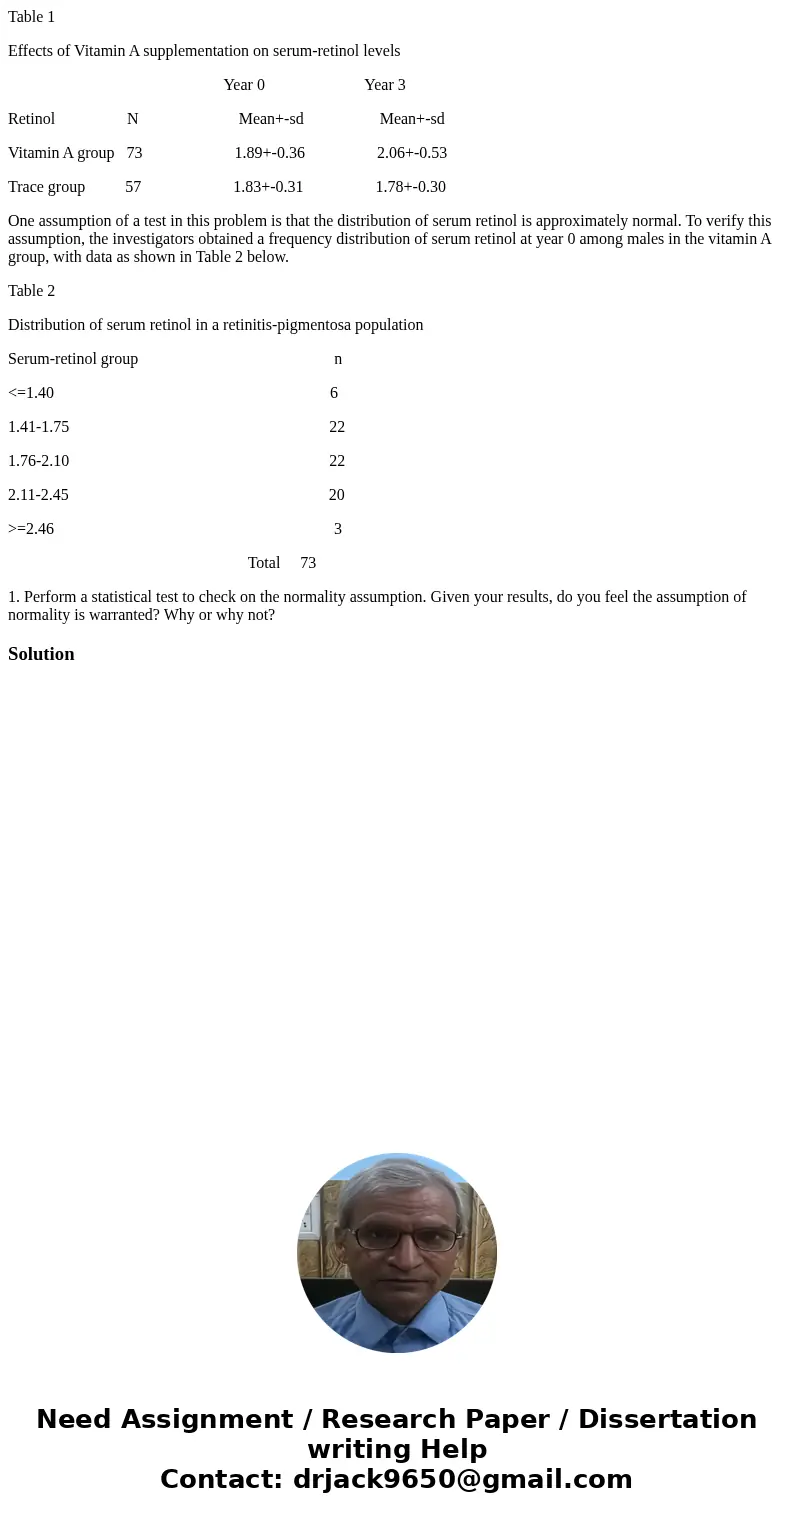
Table 1 Effects of Vitamin A supplementation on serum-retinol levels Year 0 Year 3 Retinol N Mean+-sd Mean+-sd Vitamin A group 73 1.89+-0.36 2.06+-0.53 Trace gr

Get Help Now

Submit a Take Down Notice

Tutor
Tutor: Dr Jack
Most rated tutor on our site