a 4600 54000 3500 53000 52500 2000 1500 1co0 3500 S0 4500 54
Solution
Solution - (b) Graph
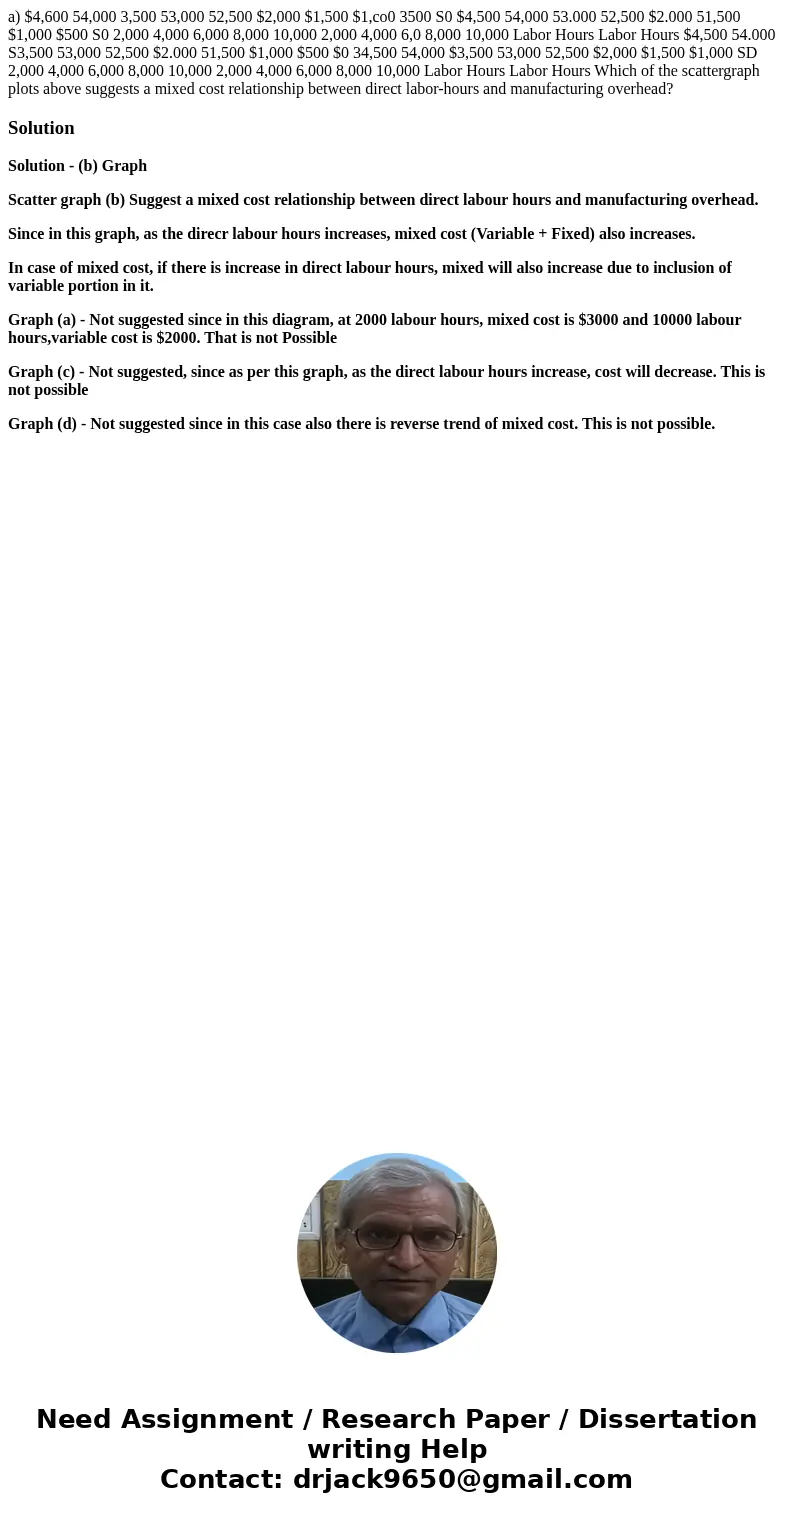
Scatter graph (b) Suggest a mixed cost relationship between direct labour hours and manufacturing overhead.
Since in this graph, as the direcr labour hours increases, mixed cost (Variable + Fixed) also increases.
In case of mixed cost, if there is increase in direct labour hours, mixed will also increase due to inclusion of variable portion in it.
Graph (a) - Not suggested since in this diagram, at 2000 labour hours, mixed cost is $3000 and 10000 labour hours,variable cost is $2000. That is not Possible
Graph (c) - Not suggested, since as per this graph, as the direct labour hours increase, cost will decrease. This is not possible
Graph (d) - Not suggested since in this case also there is reverse trend of mixed cost. This is not possible.

 Homework Sourse