The accompanying table shows the number of cars sold last mo
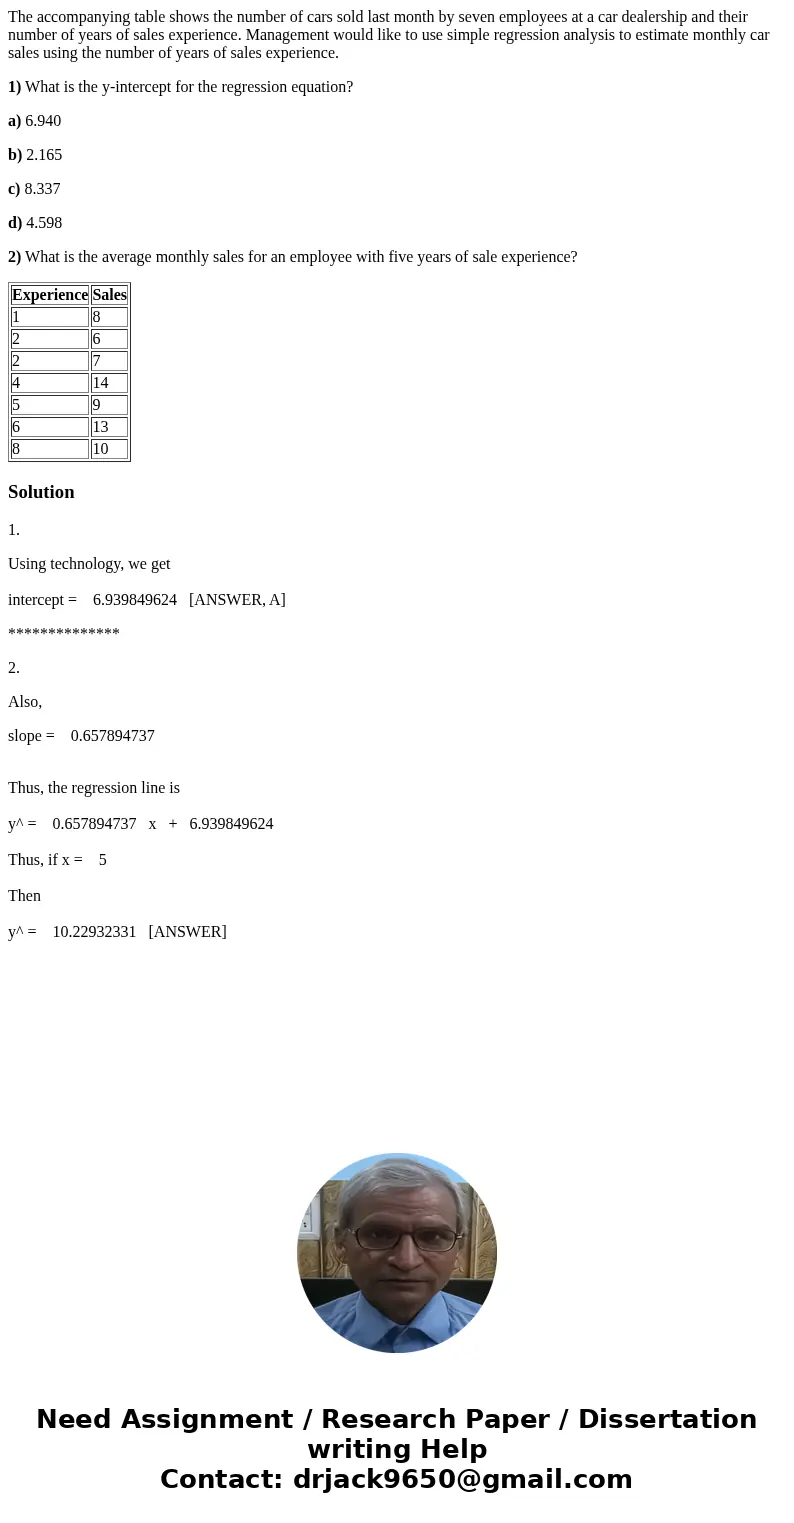
The accompanying table shows the number of cars sold last month by seven employees at a car dealership and their number of years of sales experience. Management would like to use simple regression analysis to estimate monthly car sales using the number of years of sales experience.
1) What is the y-intercept for the regression equation?
a) 6.940
b) 2.165
c) 8.337
d) 4.598
2) What is the average monthly sales for an employee with five years of sale experience?
| Experience | Sales |
| 1 | 8 |
| 2 | 6 |
| 2 | 7 |
| 4 | 14 |
| 5 | 9 |
| 6 | 13 |
| 8 | 10 |
Solution
1.
Using technology, we get
intercept = 6.939849624 [ANSWER, A]
**************
2.
Also,
slope = 0.657894737
Thus, the regression line is
y^ = 0.657894737 x + 6.939849624
Thus, if x = 5
Then
y^ = 10.22932331 [ANSWER]

 Homework Sourse