1 Find the expected frequencies 2 FInd the critical values a
1) Find the expected frequencies
2) FInd the critical values and identify the rejection regions
3) Find the chi-square test statistic
4) Decide whether to reject or fail to reject
5) Interpret
At a=0.01, test the claim that the 200 test scores shown below are normally distributed.
76.5-85.5
85.5-94.5(frequencey at 4)
| Class boundaries | Frequency |
| 49.5-58.5 | 19 |
| 58.5-67.5 | 61 |
| 67.5-76.5 | 82 |
| 76.5-85.5 | 34 |
Solution
Here it is necessary to estimate µ and 2 of the normal distribution by xbar and ^2
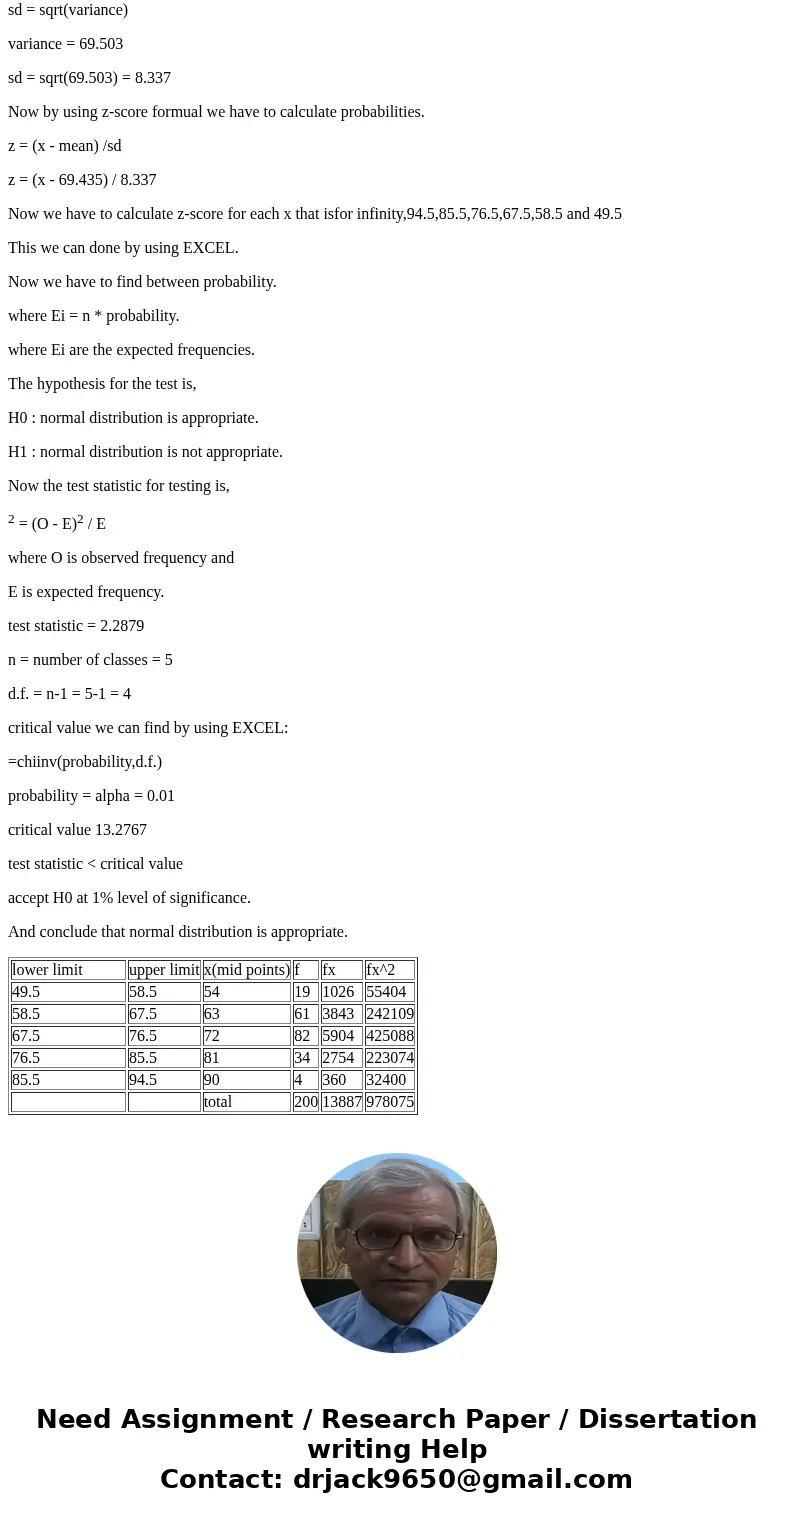
Now we have to find first class mid points.
mean class mid point = (lower limit + upper limit) / 2
mean = 13887 / 200 = 69.435
variance = [ fx2 - (fx)2 / n ] / n-1
sd = sqrt(variance)
variance = 69.503
sd = sqrt(69.503) = 8.337
Now by using z-score formual we have to calculate probabilities.
z = (x - mean) /sd
z = (x - 69.435) / 8.337
Now we have to calculate z-score for each x that isfor infinity,94.5,85.5,76.5,67.5,58.5 and 49.5
This we can done by using EXCEL.
Now we have to find between probability.
where Ei = n * probability.
where Ei are the expected frequencies.
The hypothesis for the test is,
H0 : normal distribution is appropriate.
H1 : normal distribution is not appropriate.
Now the test statistic for testing is,
2 = (O - E)2 / E
where O is observed frequency and
E is expected frequency.
test statistic = 2.2879
n = number of classes = 5
d.f. = n-1 = 5-1 = 4
critical value we can find by using EXCEL:
=chiinv(probability,d.f.)
probability = alpha = 0.01
critical value 13.2767
test statistic < critical value
accept H0 at 1% level of significance.
And conclude that normal distribution is appropriate.
| lower limit | upper limit | x(mid points) | f | fx | fx^2 |
| 49.5 | 58.5 | 54 | 19 | 1026 | 55404 |
| 58.5 | 67.5 | 63 | 61 | 3843 | 242109 |
| 67.5 | 76.5 | 72 | 82 | 5904 | 425088 |
| 76.5 | 85.5 | 81 | 34 | 2754 | 223074 |
| 85.5 | 94.5 | 90 | 4 | 360 | 32400 |
| total | 200 | 13887 | 978075 |


 Homework Sourse