I do need help I need vertical and horizontal analysis for b
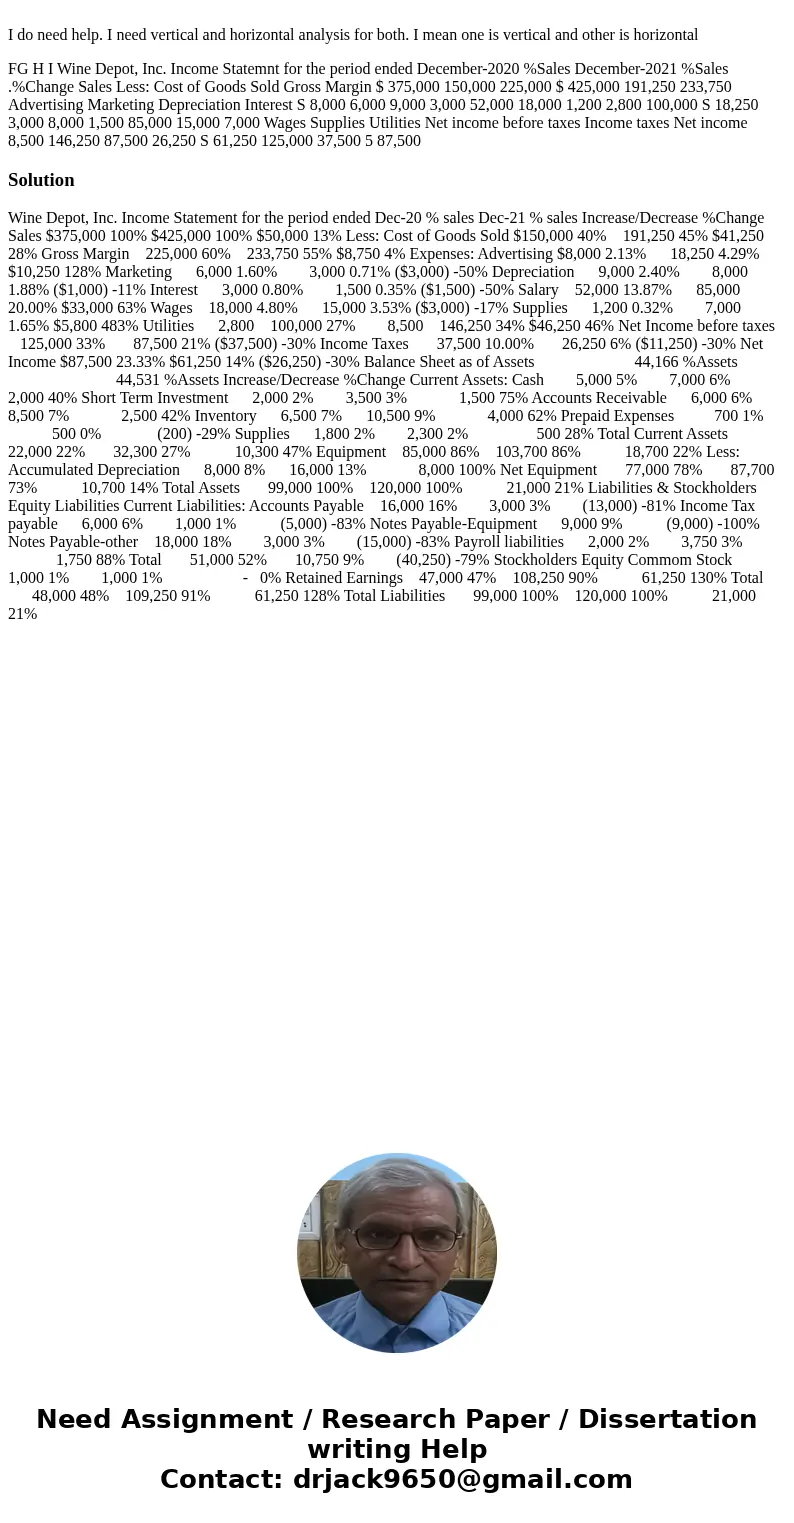
I do need help. I need vertical and horizontal analysis for both. I mean one is vertical and other is horizontal
Solution
Wine Depot, Inc. Income Statement for the period ended Dec-20 % sales Dec-21 % sales Increase/Decrease %Change Sales $375,000 100% $425,000 100% $50,000 13% Less: Cost of Goods Sold $150,000 40% 191,250 45% $41,250 28% Gross Margin 225,000 60% 233,750 55% $8,750 4% Expenses: Advertising $8,000 2.13% 18,250 4.29% $10,250 128% Marketing 6,000 1.60% 3,000 0.71% ($3,000) -50% Depreciation 9,000 2.40% 8,000 1.88% ($1,000) -11% Interest 3,000 0.80% 1,500 0.35% ($1,500) -50% Salary 52,000 13.87% 85,000 20.00% $33,000 63% Wages 18,000 4.80% 15,000 3.53% ($3,000) -17% Supplies 1,200 0.32% 7,000 1.65% $5,800 483% Utilities 2,800 100,000 27% 8,500 146,250 34% $46,250 46% Net Income before taxes 125,000 33% 87,500 21% ($37,500) -30% Income Taxes 37,500 10.00% 26,250 6% ($11,250) -30% Net Income $87,500 23.33% $61,250 14% ($26,250) -30% Balance Sheet as of Assets 44,166 %Assets 44,531 %Assets Increase/Decrease %Change Current Assets: Cash 5,000 5% 7,000 6% 2,000 40% Short Term Investment 2,000 2% 3,500 3% 1,500 75% Accounts Receivable 6,000 6% 8,500 7% 2,500 42% Inventory 6,500 7% 10,500 9% 4,000 62% Prepaid Expenses 700 1% 500 0% (200) -29% Supplies 1,800 2% 2,300 2% 500 28% Total Current Assets 22,000 22% 32,300 27% 10,300 47% Equipment 85,000 86% 103,700 86% 18,700 22% Less: Accumulated Depreciation 8,000 8% 16,000 13% 8,000 100% Net Equipment 77,000 78% 87,700 73% 10,700 14% Total Assets 99,000 100% 120,000 100% 21,000 21% Liabilities & Stockholders Equity Liabilities Current Liabilities: Accounts Payable 16,000 16% 3,000 3% (13,000) -81% Income Tax payable 6,000 6% 1,000 1% (5,000) -83% Notes Payable-Equipment 9,000 9% (9,000) -100% Notes Payable-other 18,000 18% 3,000 3% (15,000) -83% Payroll liabilities 2,000 2% 3,750 3% 1,750 88% Total 51,000 52% 10,750 9% (40,250) -79% Stockholders Equity Commom Stock 1,000 1% 1,000 1% - 0% Retained Earnings 47,000 47% 108,250 90% 61,250 130% Total 48,000 48% 109,250 91% 61,250 128% Total Liabilities 99,000 100% 120,000 100% 21,000 21%
 Homework Sourse