population 1 23 The information provided is from an excel sp
population 1
23
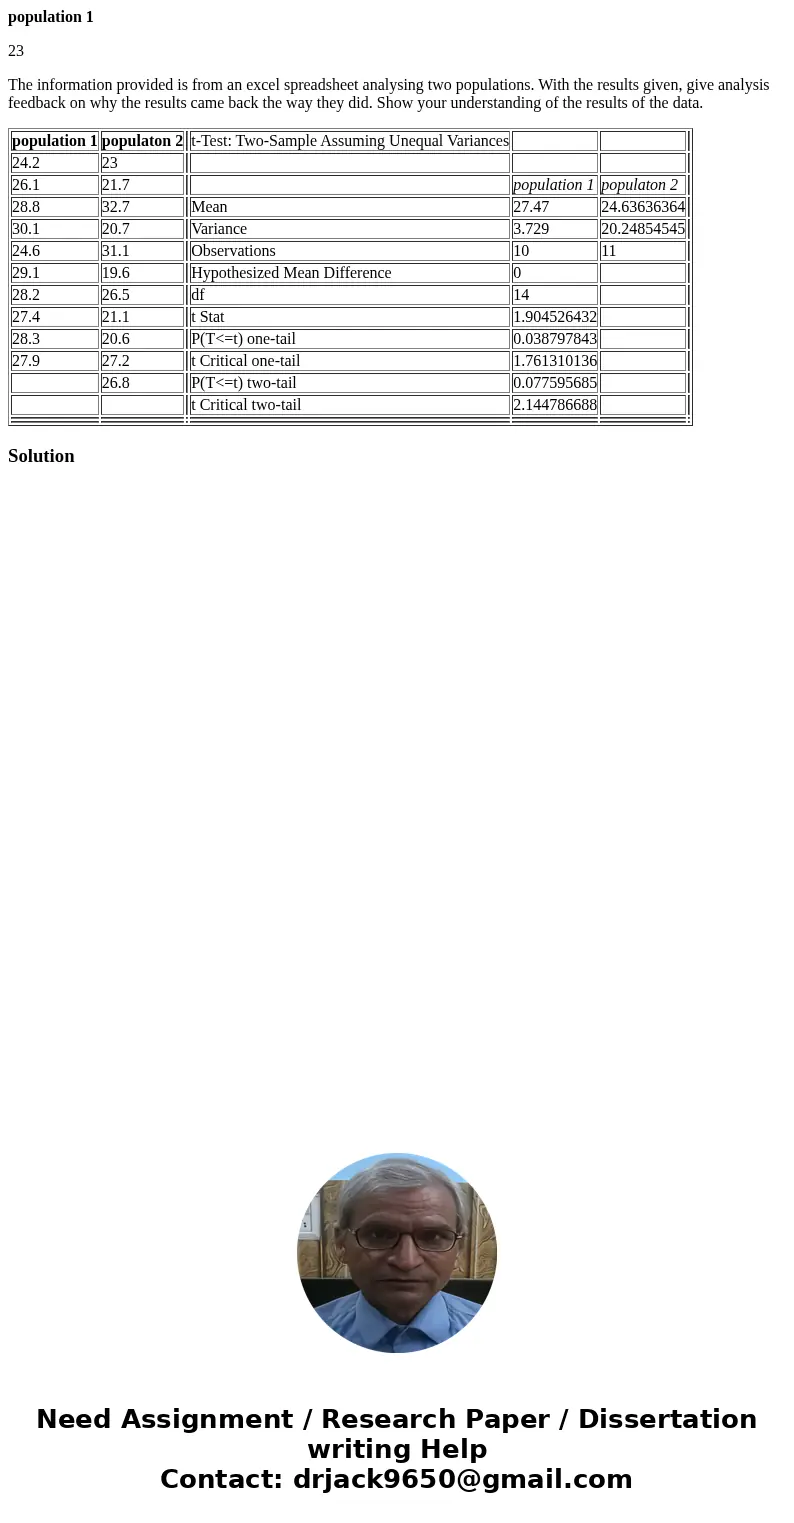
The information provided is from an excel spreadsheet analysing two populations. With the results given, give analysis feedback on why the results came back the way they did. Show your understanding of the results of the data.
| population 1 | populaton 2 | t-Test: Two-Sample Assuming Unequal Variances | ||||
| 24.2 | 23 | |||||
| 26.1 | 21.7 | population 1 | populaton 2 | |||
| 28.8 | 32.7 | Mean | 27.47 | 24.63636364 | ||
| 30.1 | 20.7 | Variance | 3.729 | 20.24854545 | ||
| 24.6 | 31.1 | Observations | 10 | 11 | ||
| 29.1 | 19.6 | Hypothesized Mean Difference | 0 | |||
| 28.2 | 26.5 | df | 14 | |||
| 27.4 | 21.1 | t Stat | 1.904526432 | |||
| 28.3 | 20.6 | P(T<=t) one-tail | 0.038797843 | |||
| 27.9 | 27.2 | t Critical one-tail | 1.761310136 | |||
| 26.8 | P(T<=t) two-tail | 0.077595685 | ||||
| t Critical two-tail | 2.144786688 | |||||
Solution

 Homework Sourse