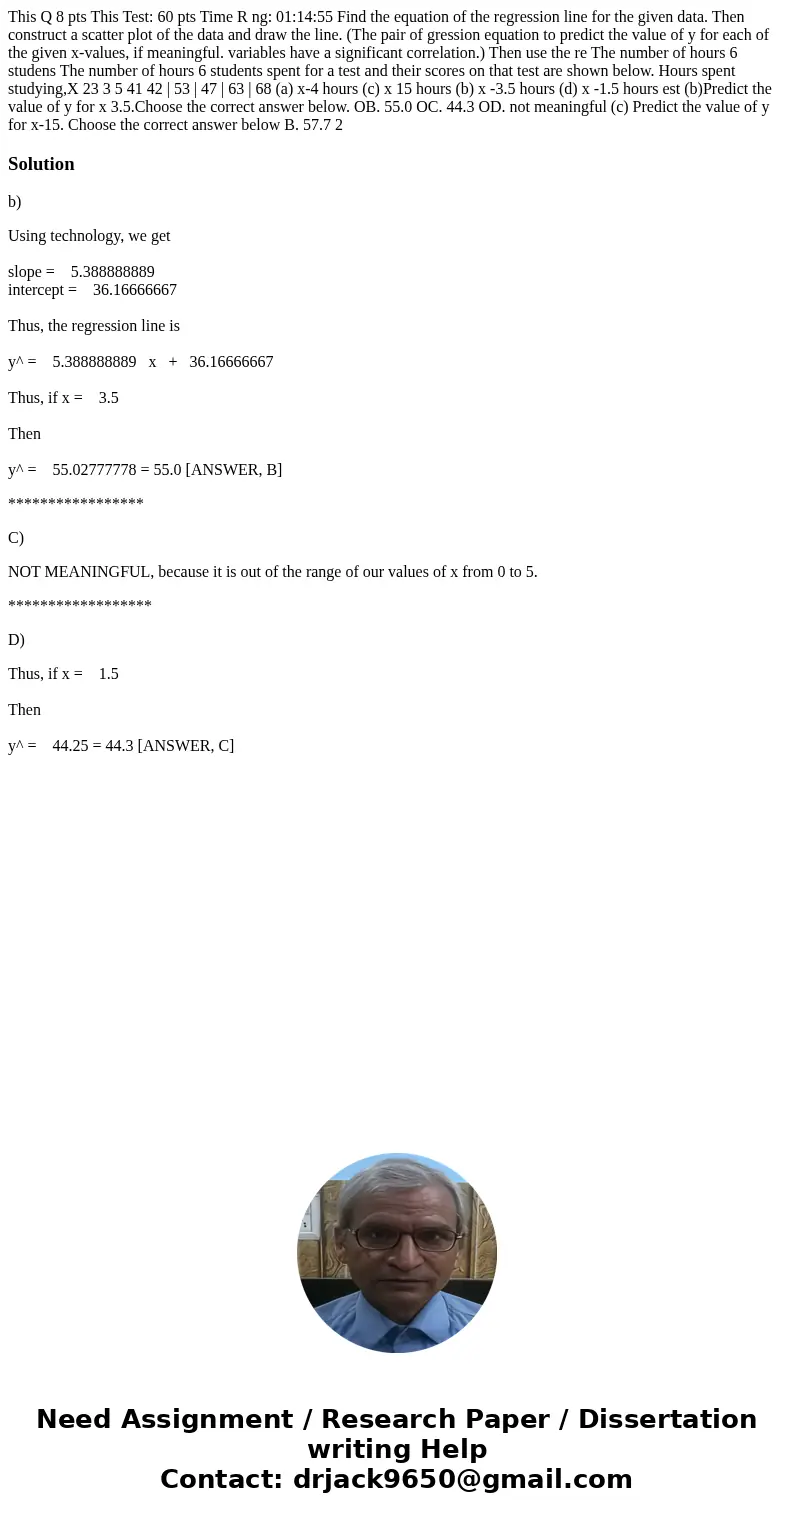
This Q 8 pts This Test 60 pts Time R ng 011455 Find the equa
This Q 8 pts This Test: 60 pts Time R ng: 01:14:55 Find the equation of the regression line for the given data. Then construct a scatter plot of the data and draw the line. (The pair of gression equation to predict the value of y for each of the given x-values, if meaningful. variables have a significant correlation.) Then use the re The number of hours 6 studens The number of hours 6 students spent for a test and their scores on that test are shown below. Hours spent studying,X 23 3 5 41 42 | 53 | 47 | 63 | 68 (a) x-4 hours (c) x 15 hours (b) x -3.5 hours (d) x -1.5 hours est (b)Predict the value of y for x 3.5.Choose the correct answer below. OB. 55.0 OC. 44.3 OD. not meaningful (c) Predict the value of y for x-15. Choose the correct answer below B. 57.7 2 
Solution
b)
Using technology, we get
slope = 5.388888889
intercept = 36.16666667
Thus, the regression line is
y^ = 5.388888889 x + 36.16666667
Thus, if x = 3.5
Then
y^ = 55.02777778 = 55.0 [ANSWER, B]
*****************
C)
NOT MEANINGFUL, because it is out of the range of our values of x from 0 to 5.
******************
D)
Thus, if x = 1.5
Then
y^ = 44.25 = 44.3 [ANSWER, C]

 Homework Sourse