1The Survey of Study Habits and Attitudes SSHA is a test tha
1.The Survey of Study Habits and Attitudes (SSHA) is a test that evaluates college student’s motivation, study habits, and attitude toward school. The SSHA data for 19 first year college women are:
154, 109, 137, 115, 152, 140, 154, 178, 101,
103, 126, 126, 137, 165, 165, 129, 200, 148, 138
The SSHA scores for 20 first-year college men are:
108, 140, 114, 91, 180, 115, 126, 92, 169, 146,
109, 132, 75, 88, 113, 151, 70, 115, 187, 104
For the above two data sets
a)Find the five-number summaries.
b)Make a side –by-side box plots of the distribution
c)Find the mean and standard deviation for the two groups.
d)Compare the distribution of the SSHA scores for male and female college students.
You can use the following information:
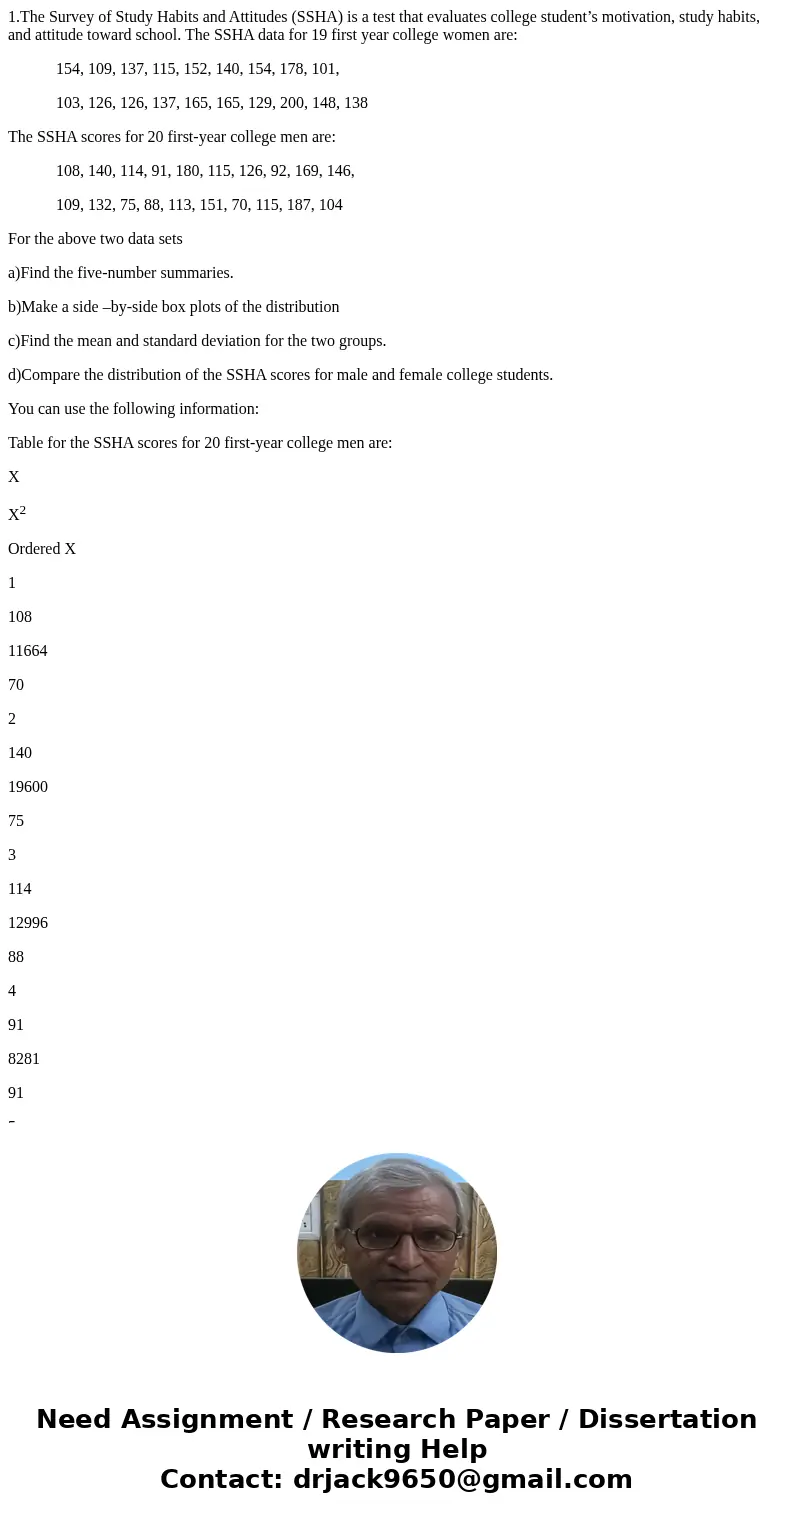
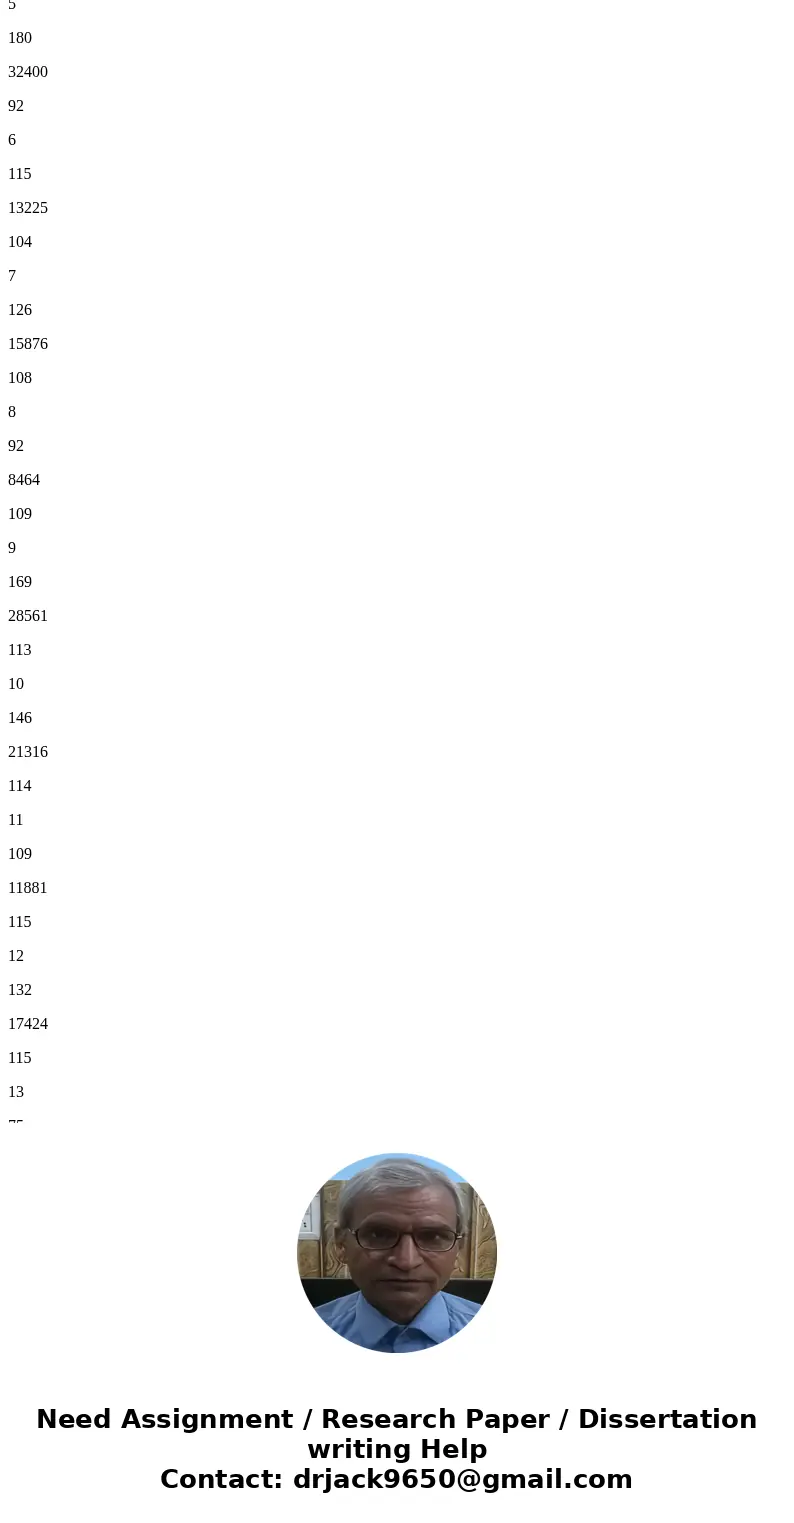
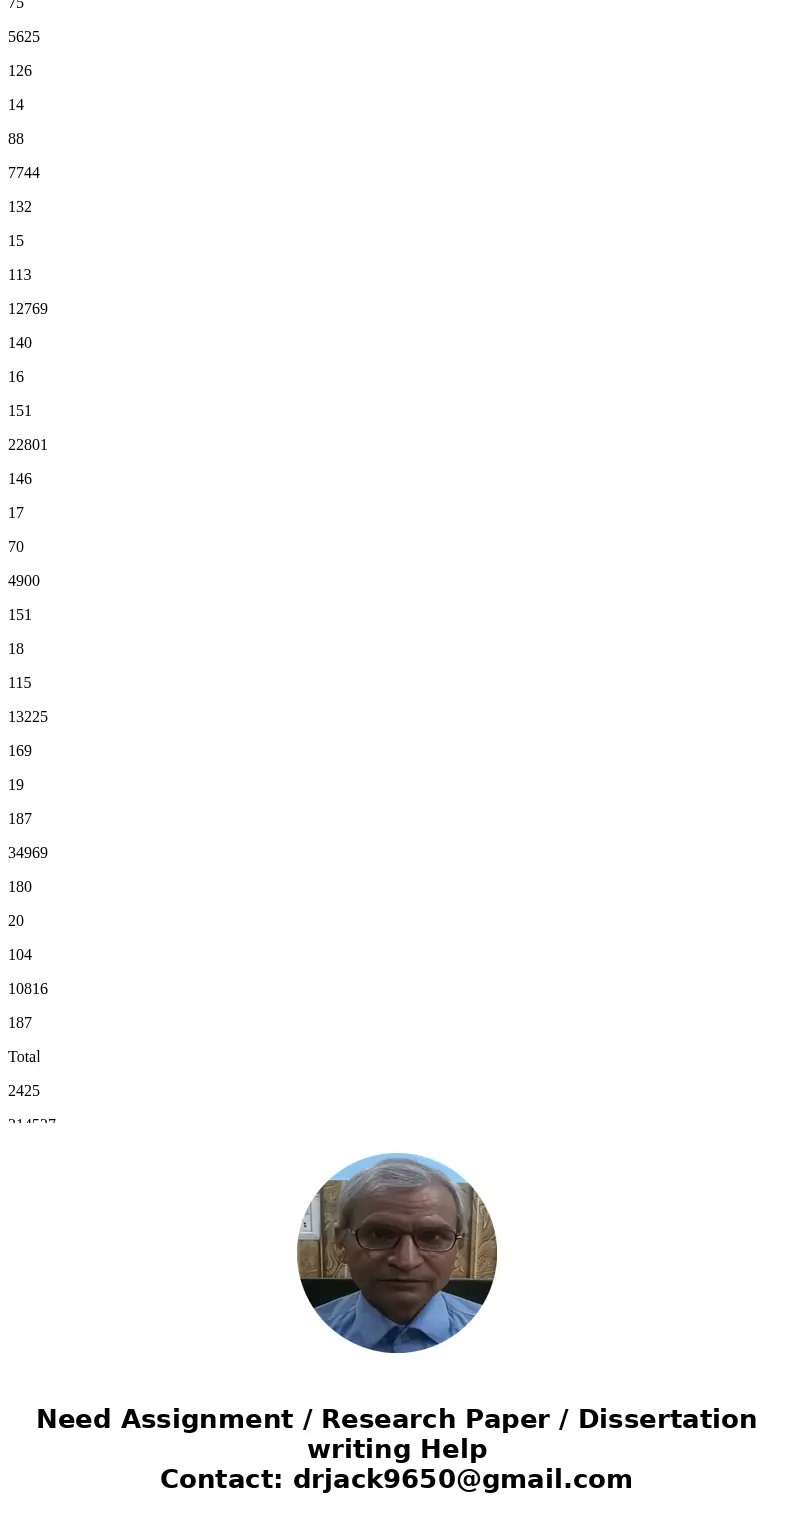
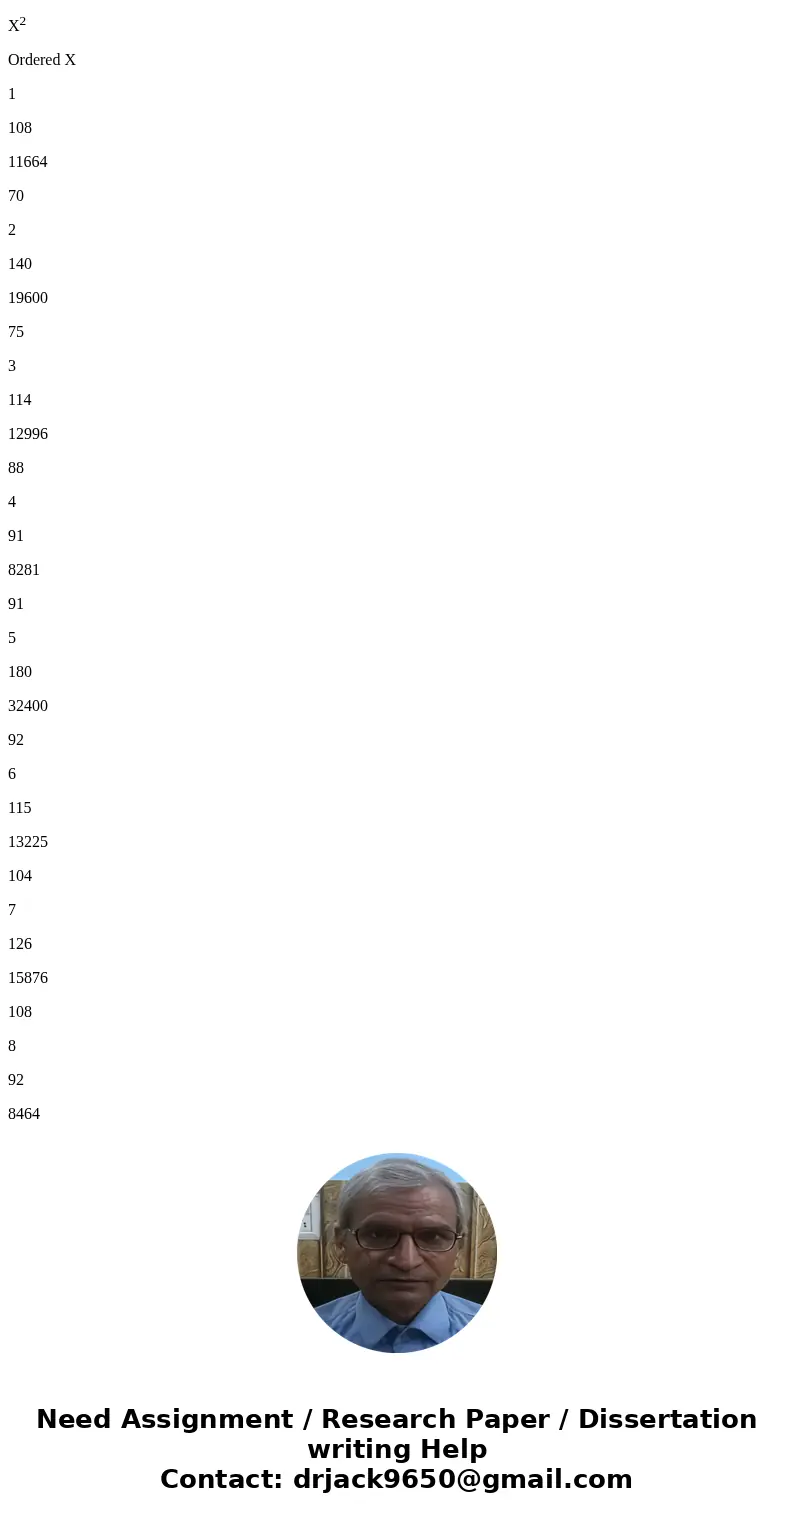
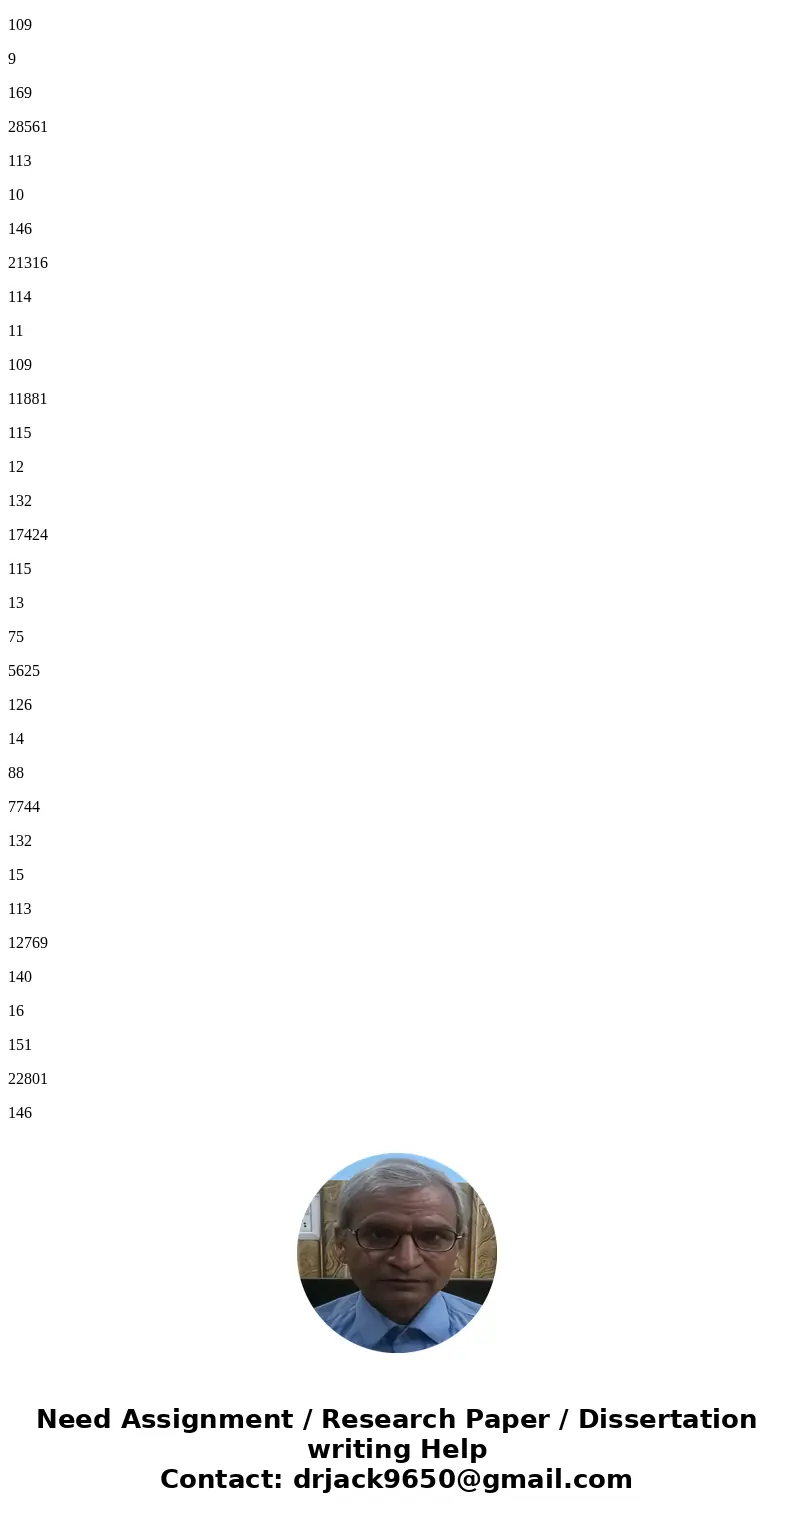
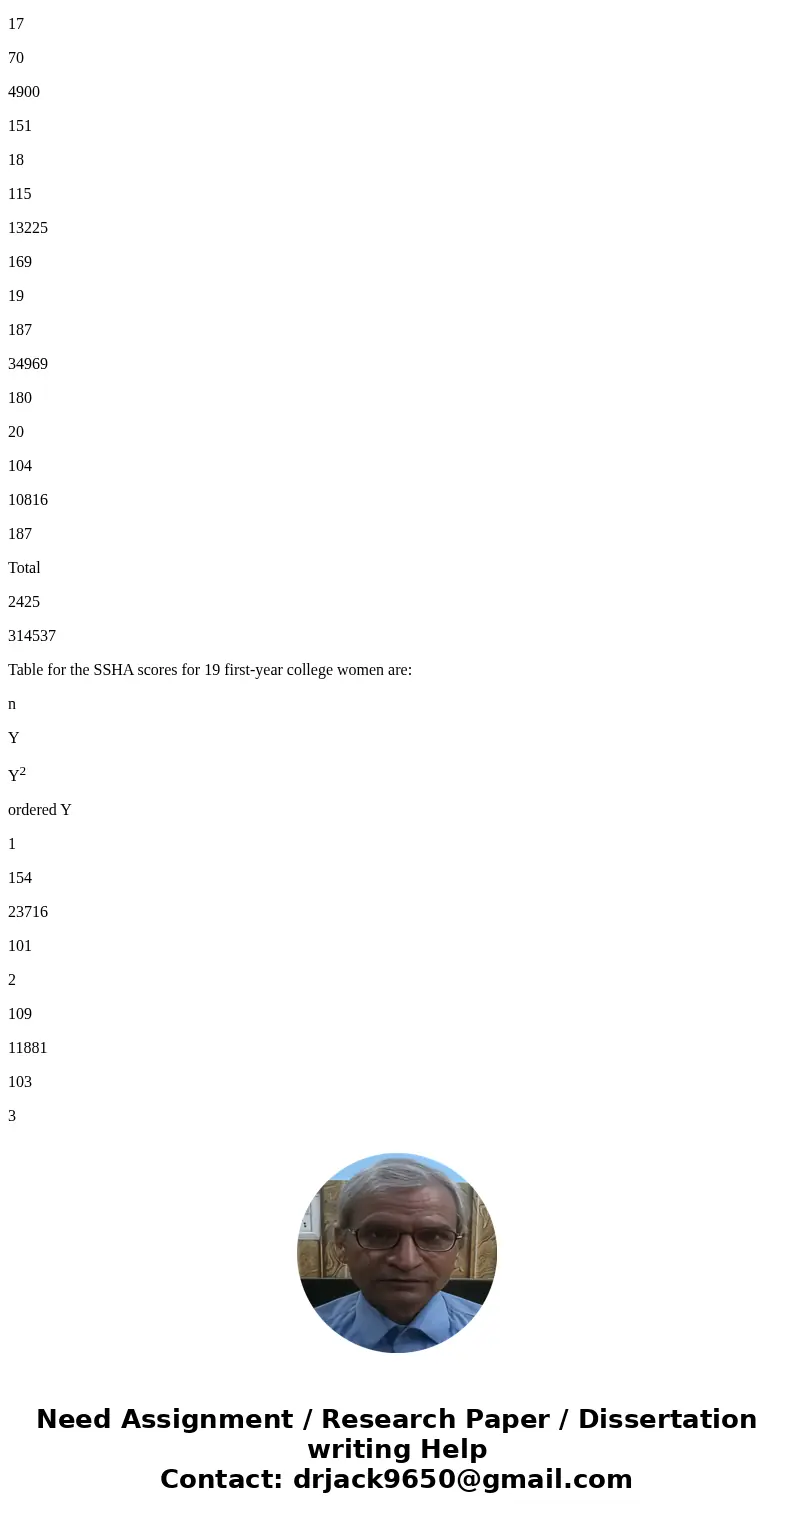
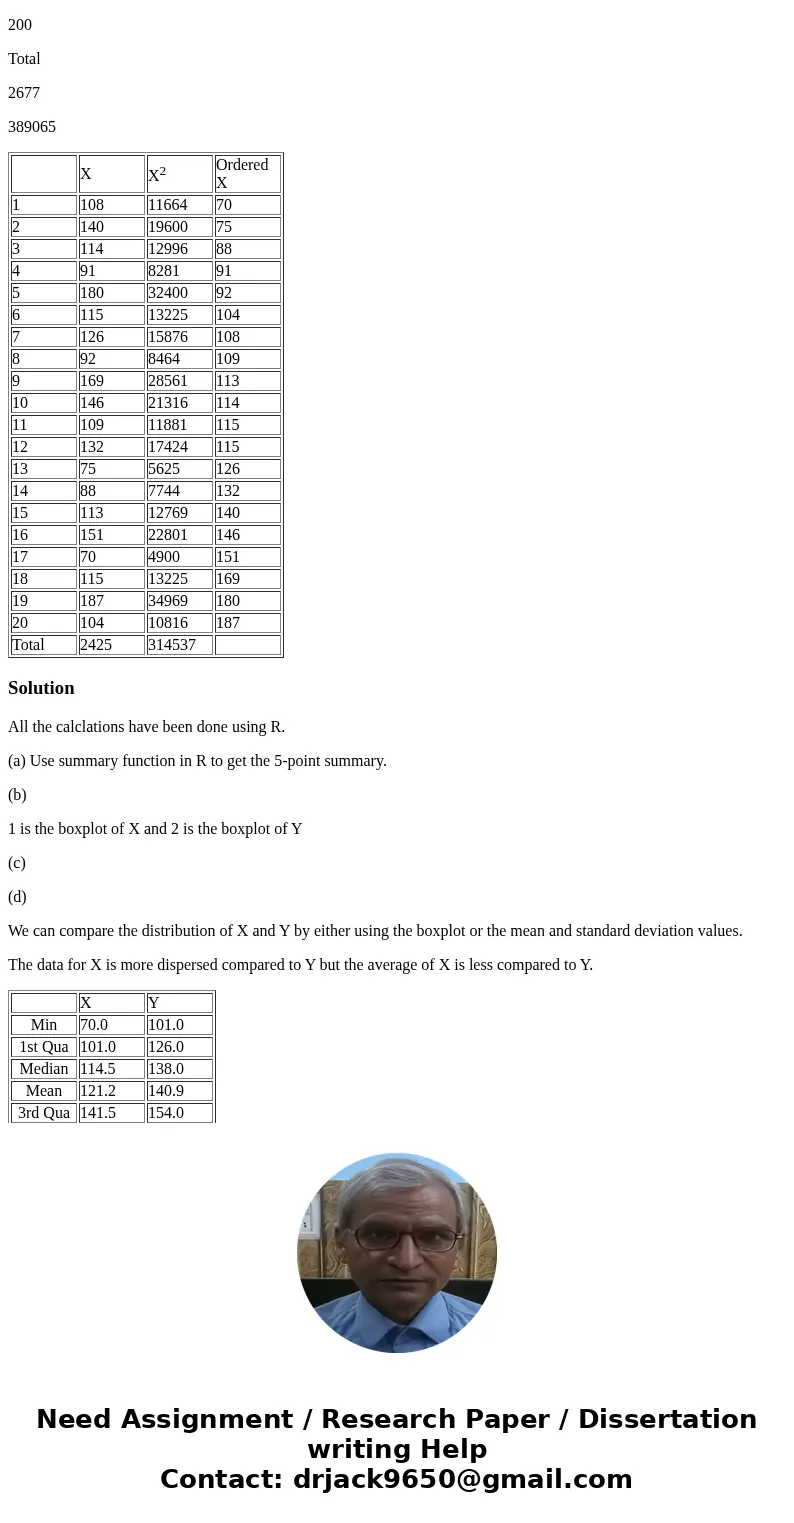
Table for the SSHA scores for 20 first-year college men are:
X
X2
Ordered X
1
108
11664
70
2
140
19600
75
3
114
12996
88
4
91
8281
91
5
180
32400
92
6
115
13225
104
7
126
15876
108
8
92
8464
109
9
169
28561
113
10
146
21316
114
11
109
11881
115
12
132
17424
115
13
75
5625
126
14
88
7744
132
15
113
12769
140
16
151
22801
146
17
70
4900
151
18
115
13225
169
19
187
34969
180
20
104
10816
187
Total
2425
314537
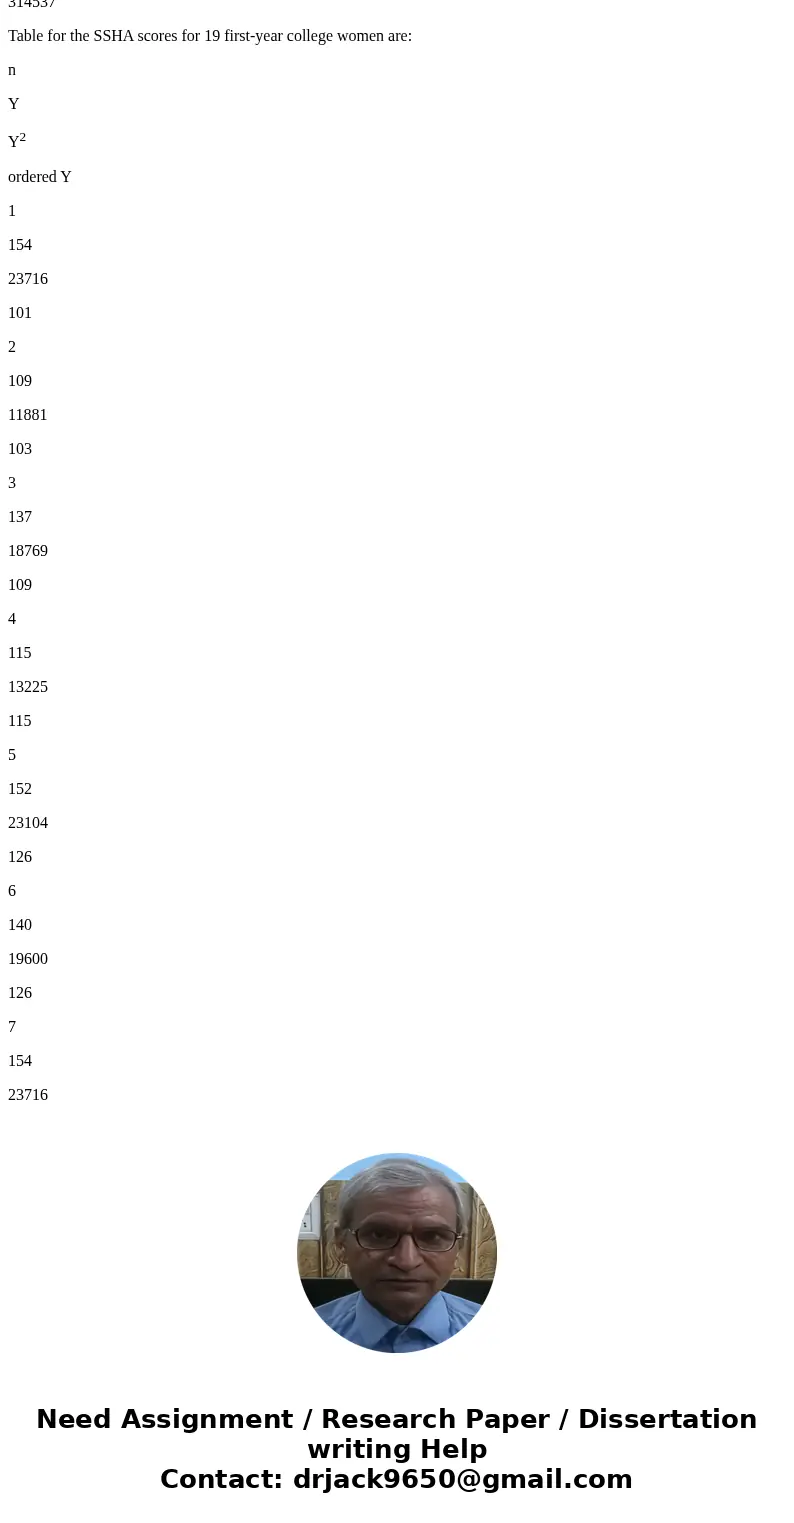
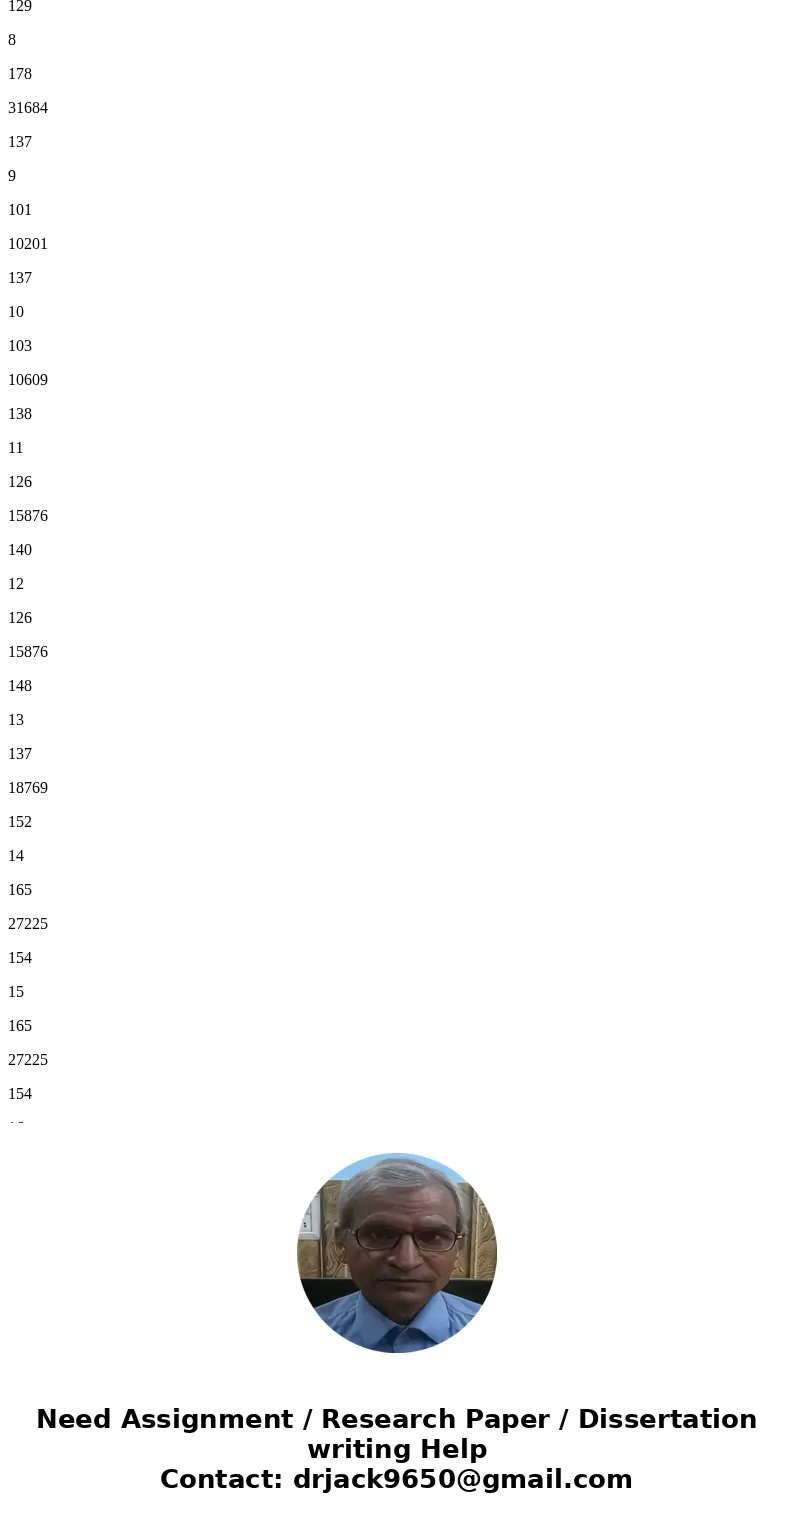
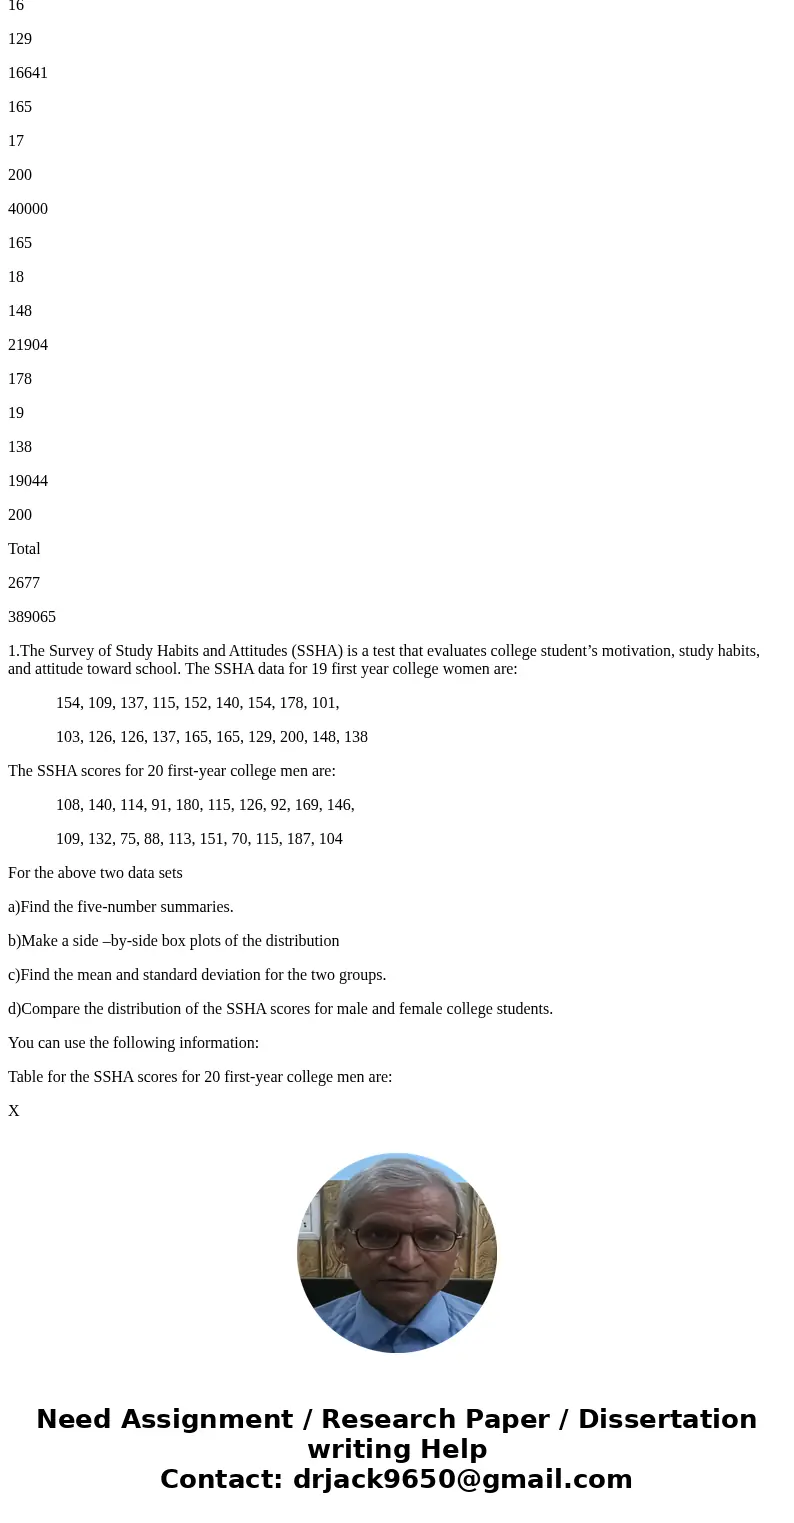
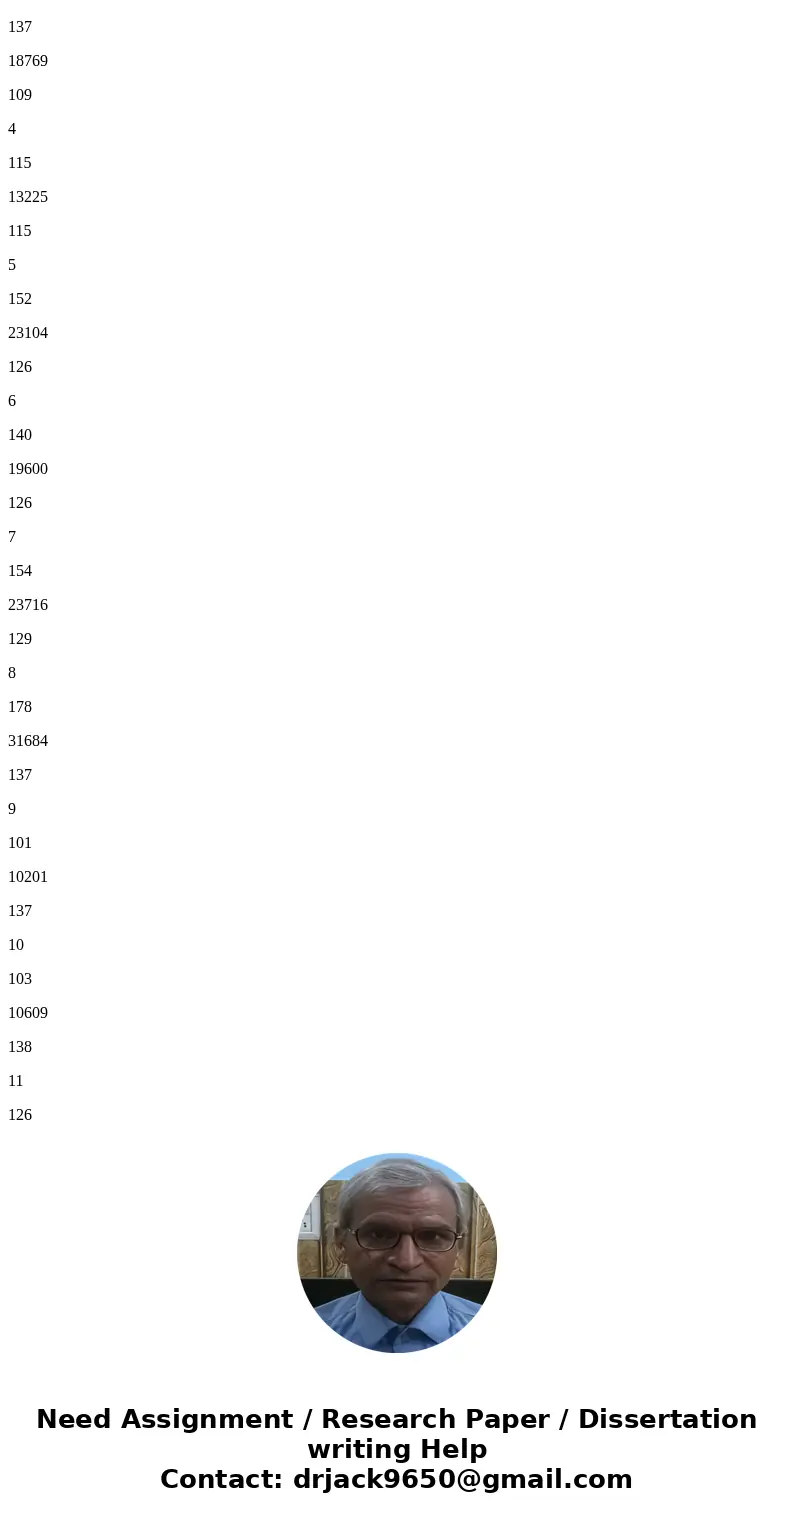
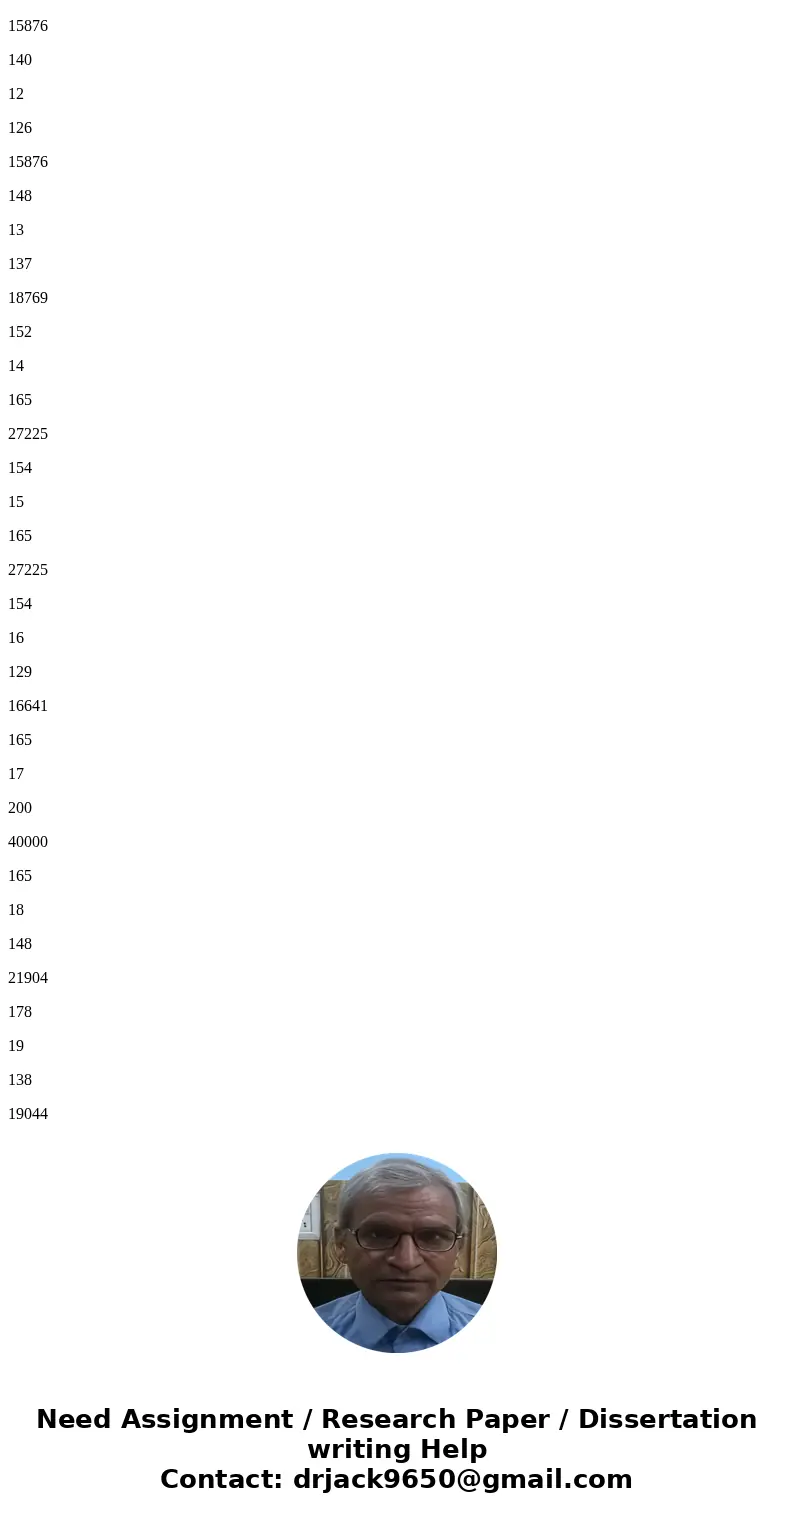
Table for the SSHA scores for 19 first-year college women are:
n
Y
Y2
ordered Y
1
154
23716
101
2
109
11881
103
3
137
18769
109
4
115
13225
115
5
152
23104
126
6
140
19600
126
7
154
23716
129
8
178
31684
137
9
101
10201
137
10
103
10609
138
11
126
15876
140
12
126
15876
148
13
137
18769
152
14
165
27225
154
15
165
27225
154
16
129
16641
165
17
200
40000
165
18
148
21904
178
19
138
19044
200
Total
2677
389065
| X | X2 | Ordered X | |
| 1 | 108 | 11664 | 70 |
| 2 | 140 | 19600 | 75 |
| 3 | 114 | 12996 | 88 |
| 4 | 91 | 8281 | 91 |
| 5 | 180 | 32400 | 92 |
| 6 | 115 | 13225 | 104 |
| 7 | 126 | 15876 | 108 |
| 8 | 92 | 8464 | 109 |
| 9 | 169 | 28561 | 113 |
| 10 | 146 | 21316 | 114 |
| 11 | 109 | 11881 | 115 |
| 12 | 132 | 17424 | 115 |
| 13 | 75 | 5625 | 126 |
| 14 | 88 | 7744 | 132 |
| 15 | 113 | 12769 | 140 |
| 16 | 151 | 22801 | 146 |
| 17 | 70 | 4900 | 151 |
| 18 | 115 | 13225 | 169 |
| 19 | 187 | 34969 | 180 |
| 20 | 104 | 10816 | 187 |
| Total | 2425 | 314537 |
Solution
All the calclations have been done using R.
(a) Use summary function in R to get the 5-point summary.
(b)
1 is the boxplot of X and 2 is the boxplot of Y
(c)
(d)
We can compare the distribution of X and Y by either using the boxplot or the mean and standard deviation values.
The data for X is more dispersed compared to Y but the average of X is less compared to Y.
| X | Y | |
| Min | 70.0 | 101.0 |
| 1st Qua | 101.0 | 126.0 |
| Median | 114.5 | 138.0 |
| Mean | 121.2 | 140.9 |
| 3rd Qua | 141.5 | 154.0 |
| Max | 187.0 | 200.0 |
 Homework Sourse