In a study of the effects of stress on behavior in rats 70 r
In a study of the effects of stress on behavior in rats, 70 rats were randomly assigned to either a stressful environment or a control (nonstressful) environment. After 21 days, the change in weight (in grams) was determined for each rat. The table below summarizes data on weight gain.
(The study report gave the standard error of the mean s/n, abbreviated as SEM, rather than the standard deviation s.)
What are the standard deviations (±0.001) for the two groups??
For \"Stress\" group s1= __
For \"No stress\" group s2= __
What degrees of freedom does the conservative Option 2 use for two-sample t procedures for these samples? __
Test the null hypothesis of no difference between the two group means against the two-sided alternative for = 10%.
The null hypothesis is
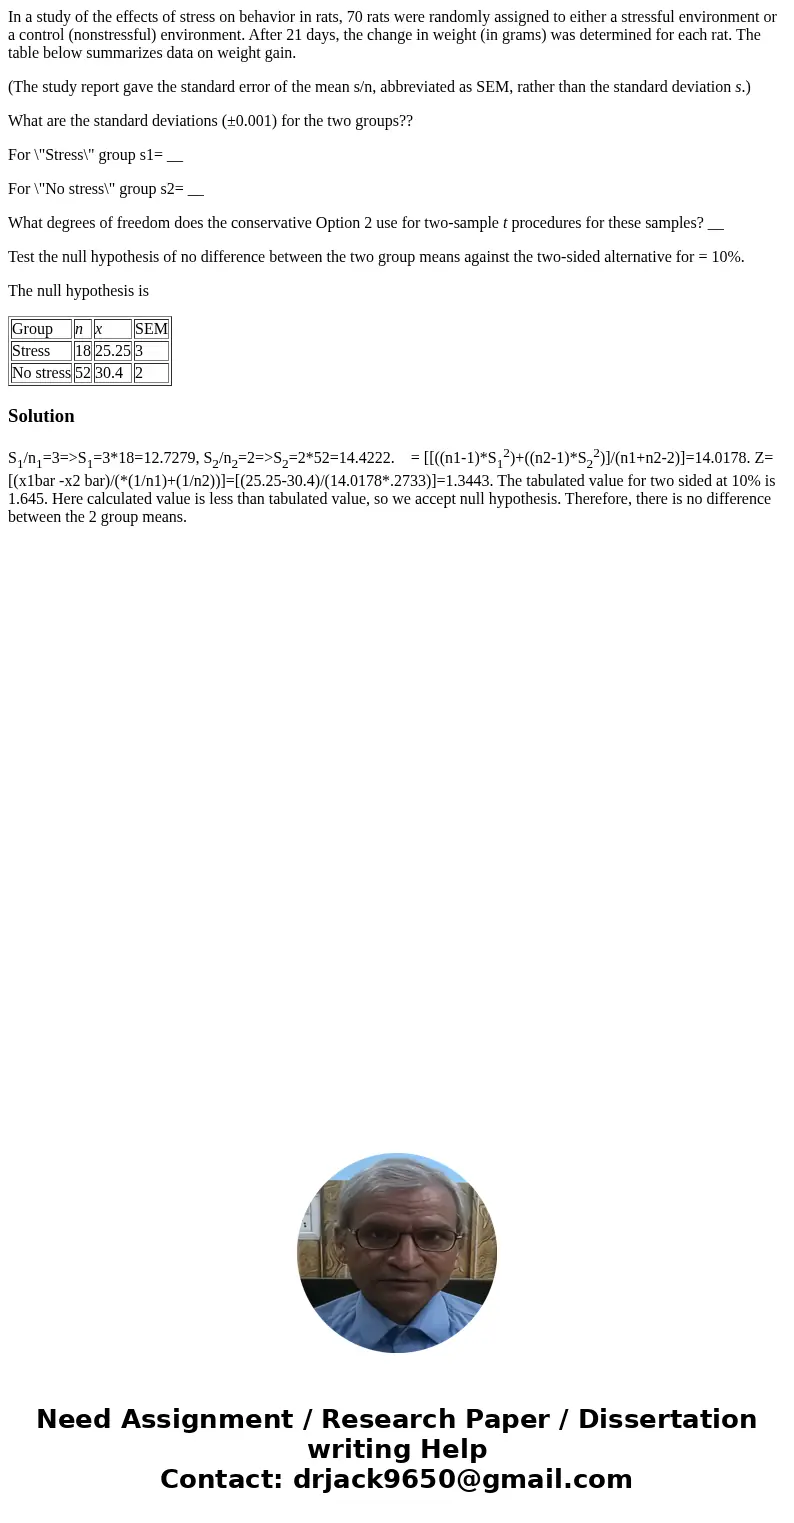
| Group | n | x | SEM |
| Stress | 18 | 25.25 | 3 |
| No stress | 52 | 30.4 | 2 |
Solution
S1/n1=3=>S1=3*18=12.7279, S2/n2=2=>S2=2*52=14.4222. = [[((n1-1)*S12)+((n2-1)*S22)]/(n1+n2-2)]=14.0178. Z=[(x1bar -x2 bar)/(*(1/n1)+(1/n2))]=[(25.25-30.4)/(14.0178*.2733)]=1.3443. The tabulated value for two sided at 10% is 1.645. Here calculated value is less than tabulated value, so we accept null hypothesis. Therefore, there is no difference between the 2 group means.

 Homework Sourse