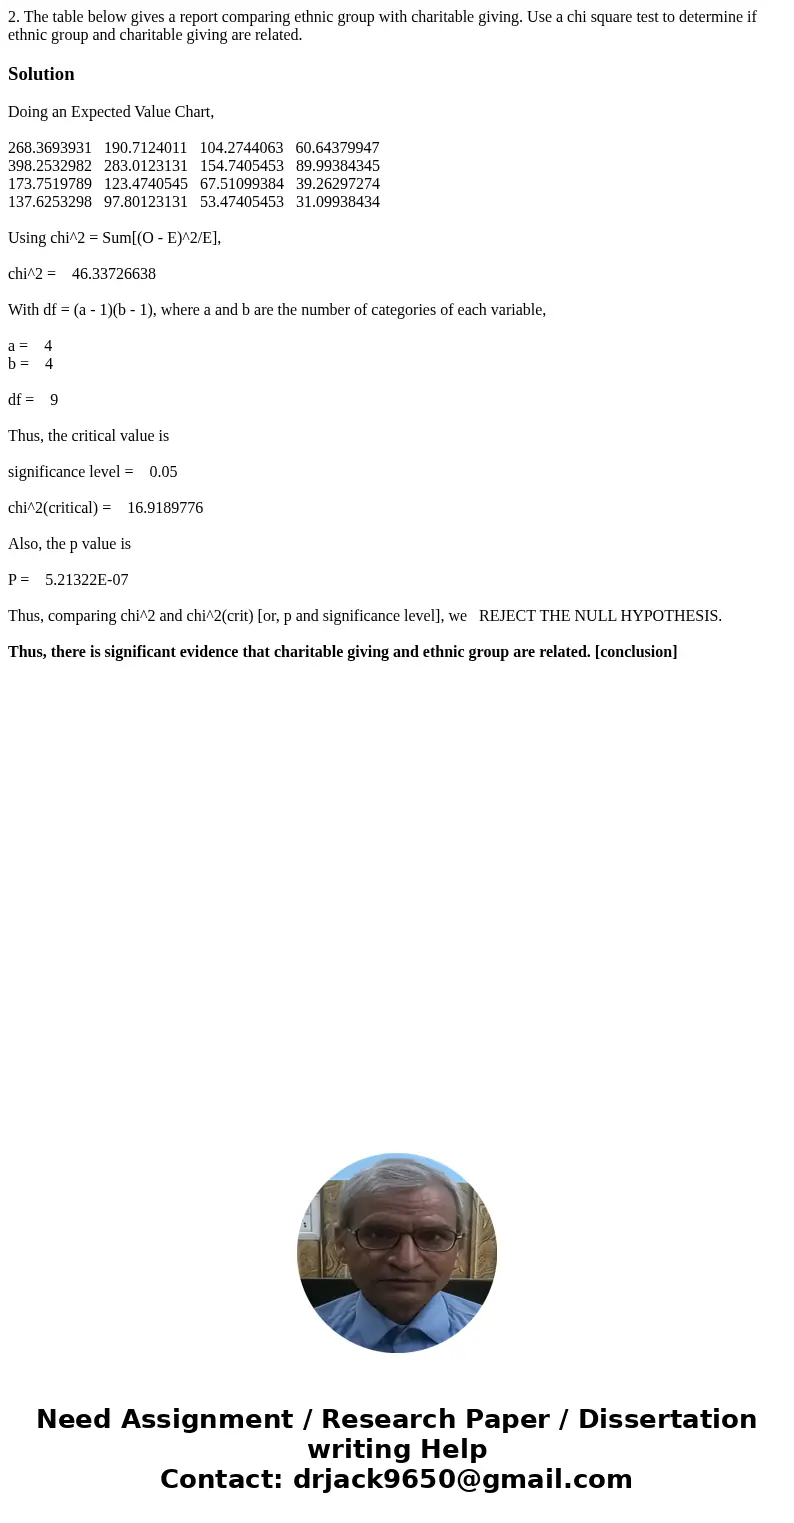
2 The table below gives a report comparing ethnic group with
Solution
Doing an Expected Value Chart,
268.3693931 190.7124011 104.2744063 60.64379947
398.2532982 283.0123131 154.7405453 89.99384345
173.7519789 123.4740545 67.51099384 39.26297274
137.6253298 97.80123131 53.47405453 31.09938434
Using chi^2 = Sum[(O - E)^2/E],
chi^2 = 46.33726638
With df = (a - 1)(b - 1), where a and b are the number of categories of each variable,
a = 4
b = 4
df = 9
Thus, the critical value is
significance level = 0.05
chi^2(critical) = 16.9189776
Also, the p value is
P = 5.21322E-07
Thus, comparing chi^2 and chi^2(crit) [or, p and significance level], we REJECT THE NULL HYPOTHESIS.
Thus, there is significant evidence that charitable giving and ethnic group are related. [conclusion]

 Homework Sourse