7 Questions SHOW ALL YOUR WORK Problem 1 Consider the sampl
7 Questions - SHOW ALL YOUR WORK
Problem 1)
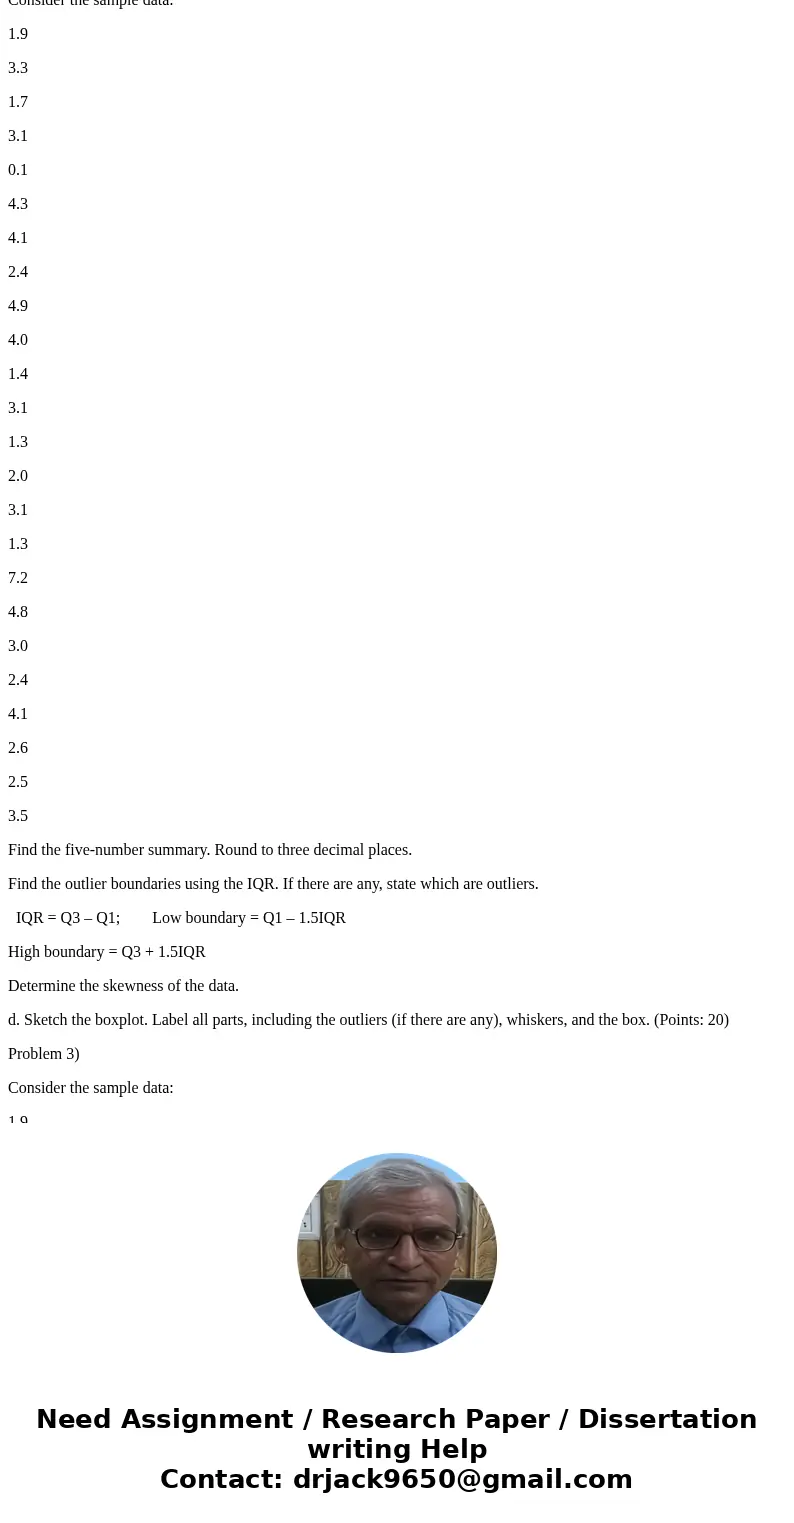
Consider the sample data of ratings (on a scale from 0.0 to 10.0) for 24 participants on the America’s Got No Talent variety show:
1.9
3.3
1.7
3.1
0.1
4.3
4.1
2.4
4.9
4.0
1.4
3.1
1.3
2.0
3.1
1.3
7.2
4.8
3.0
2.4
4.1
2.6
2.5
3.5
Construct an ordered stem-and-leaf plot. Be sure to include a legend and a title.
Identify the modal stem.
Determine the range of the data. R = H – L
d. Calculate and S to three decimal places. (Points: 16)
Problem 2)
Consider the sample data:
1.9
3.3
1.7
3.1
0.1
4.3
4.1
2.4
4.9
4.0
1.4
3.1
1.3
2.0
3.1
1.3
7.2
4.8
3.0
2.4
4.1
2.6
2.5
3.5
Find the five-number summary. Round to three decimal places.
Find the outlier boundaries using the IQR. If there are any, state which are outliers.
IQR = Q3 – Q1; Low boundary = Q1 – 1.5IQR
High boundary = Q3 + 1.5IQR
Determine the skewness of the data.
d. Sketch the boxplot. Label all parts, including the outliers (if there are any), whiskers, and the box. (Points: 20)
Problem 3)
Consider the sample data:
1.9
3.3
1.7
3.1
0.1
4.3
4.1
2.4
4.9
4.0
1.4
3.1
1.3
2.0
3.1
1.3
7.2
4.8
3.0
2.4
4.1
2.6
2.5
3.5
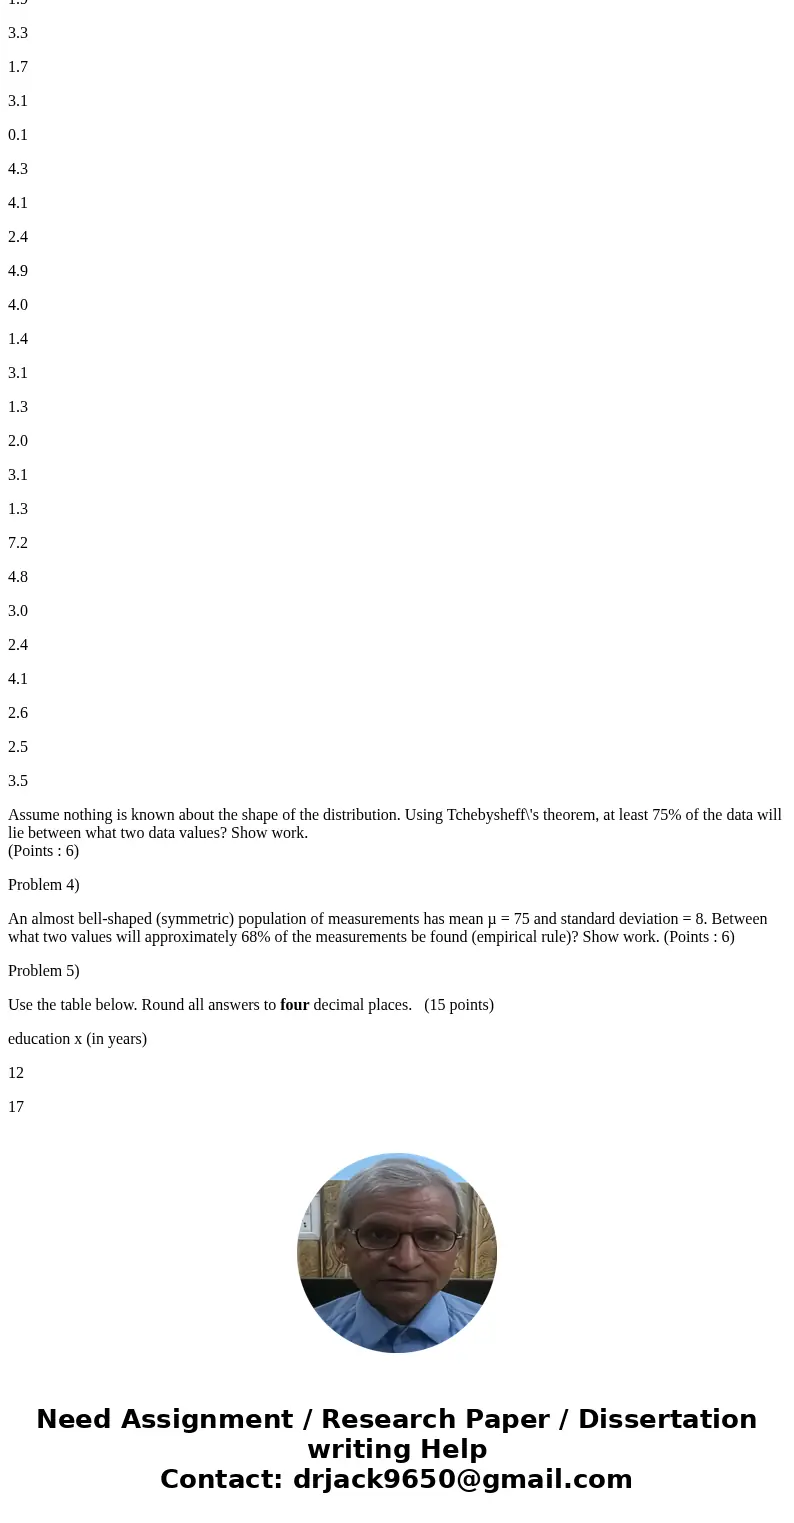
Assume nothing is known about the shape of the distribution. Using Tchebysheff\'s theorem, at least 75% of the data will lie between what two data values? Show work.
(Points : 6)
Problem 4)
An almost bell-shaped (symmetric) population of measurements has mean µ = 75 and standard deviation = 8. Between what two values will approximately 68% of the measurements be found (empirical rule)? Show work. (Points : 6)
Problem 5)
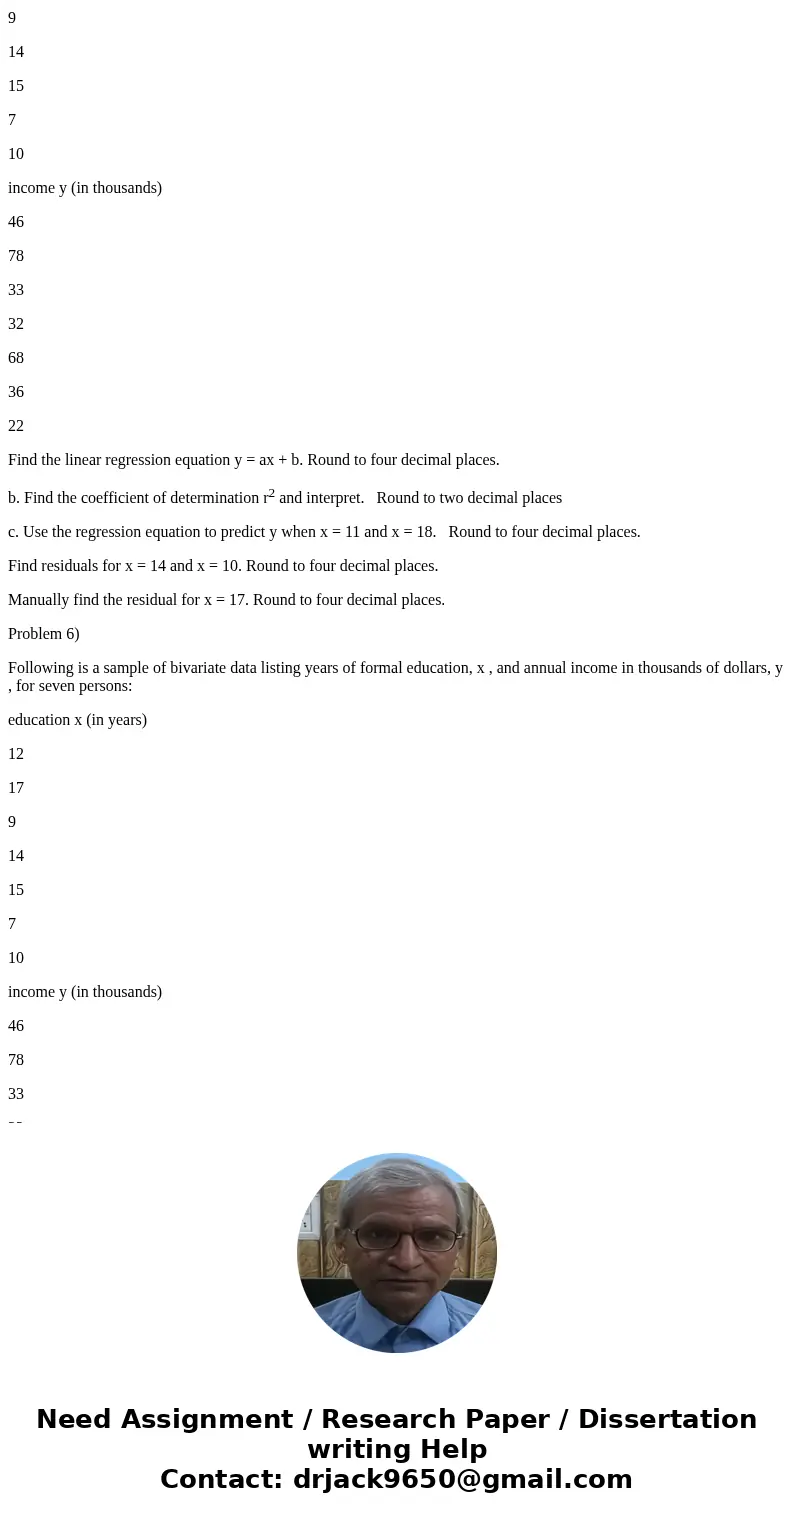
Use the table below. Round all answers to four decimal places. (15 points)
education x (in years)
12
17
9
14
15
7
10
income y (in thousands)
46
78
33
32
68
36
22
Find the linear regression equation y = ax + b. Round to four decimal places.
b. Find the coefficient of determination r2 and interpret. Round to two decimal places
c. Use the regression equation to predict y when x = 11 and x = 18. Round to four decimal places.
Find residuals for x = 14 and x = 10. Round to four decimal places.
Manually find the residual for x = 17. Round to four decimal places.
Problem 6)
Following is a sample of bivariate data listing years of formal education, x , and annual income in thousands of dollars, y , for seven persons:
education x (in years)
12
17
9
14
15
7
10
income y (in thousands)
46
78
33
32
68
36
22
Find Sxy using both formulas.
Calculate to two decimal places and interpret the sample correlation coefficient r. (12 pts.)
Problem 7)
Consider the sample data:
1.9
3.3
1.7
3.1
0.1
4.3
4.1
2.4
4.9
4.0
1.4
3.1
1.3
2.0
3.1
1.3
7.2
4.8
3.0
2.4
4.1
2.6
2.5
3.5
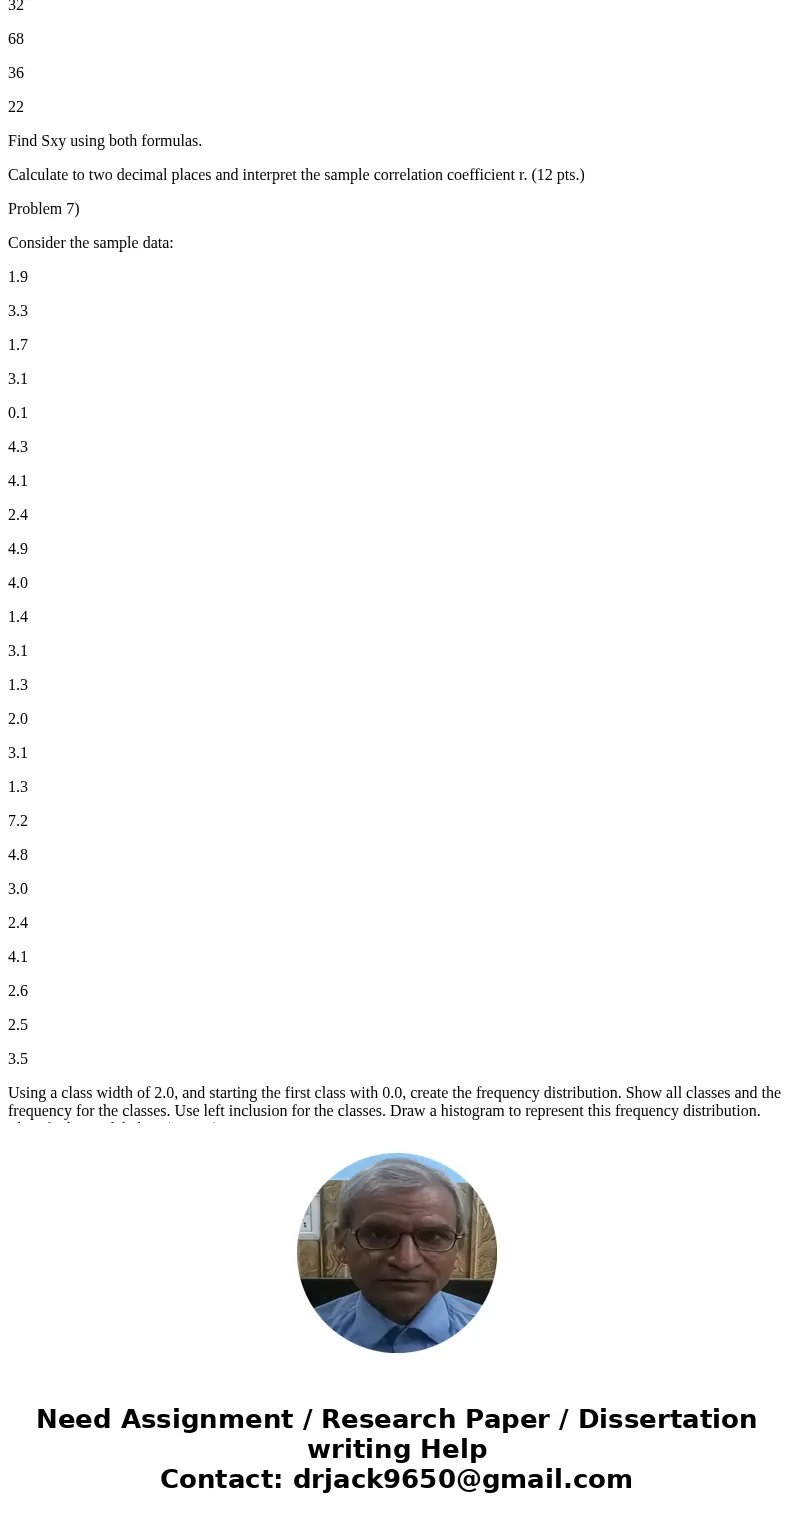
Using a class width of 2.0, and starting the first class with 0.0, create the frequency distribution. Show all classes and the frequency for the classes. Use left inclusion for the classes. Draw a histogram to represent this frequency distribution. Identify the modal class (16 pts.)
Problem 8)
Create a set of bivariate data that has 8 ordered pairs (points) which will have a correlation coefficient equal to -1. Explain why your example has all residuals equal to 0. (9 points)
| 1.9 | 3.3 | 1.7 | 3.1 | 0.1 | 4.3 |
| 4.1 | 2.4 | 4.9 | 4.0 | 1.4 | 3.1 |
| 1.3 | 2.0 | 3.1 | 1.3 | 7.2 | 4.8 |
| 3.0 | 2.4 | 4.1 | 2.6 | 2.5 | 3.5 |
Solution
7)
The step and leaf plot is
Stem
Leaf
0
1
1
3 3 4 7 9
2
0 4 4 5 6
3
0 1 1 1 3 5
4
0 1 1 3 8 9
5
6
7
2
Minimum 0.1
Maximum 7.2
So Range 7.1
The standard deviation is 1.549
| Stem | Leaf |
| 0 | 1 |
| 1 | 3 3 4 7 9 |
| 2 | 0 4 4 5 6 |
| 3 | 0 1 1 1 3 5 |
| 4 | 0 1 1 3 8 9 |
| 5 | |
| 6 | |
| 7 | 2 |

 Homework Sourse